An Android app that counts bacterial colonies from plate photos, offline. Two small YOLO models do the counting, in about three quarters of a second a plate on my phone.
to count a plate on my phone
0.74 s
average error in colonies per plate, against 25.7 for the threshold method
16.6
test plates counted the same on phone and laptop
16 of 16
This app counts bacterial colonies on membrane filtration plates from a photo. I developed it in collaboration with Moushumi Hazra, a postdoctoral researcher at the University of Nebraska-Lincoln. Under a blue lamp the colonies glow cyan against blue agar. Each plate also has a printed counting grid and a label written in black marker. The count has to ignore both.
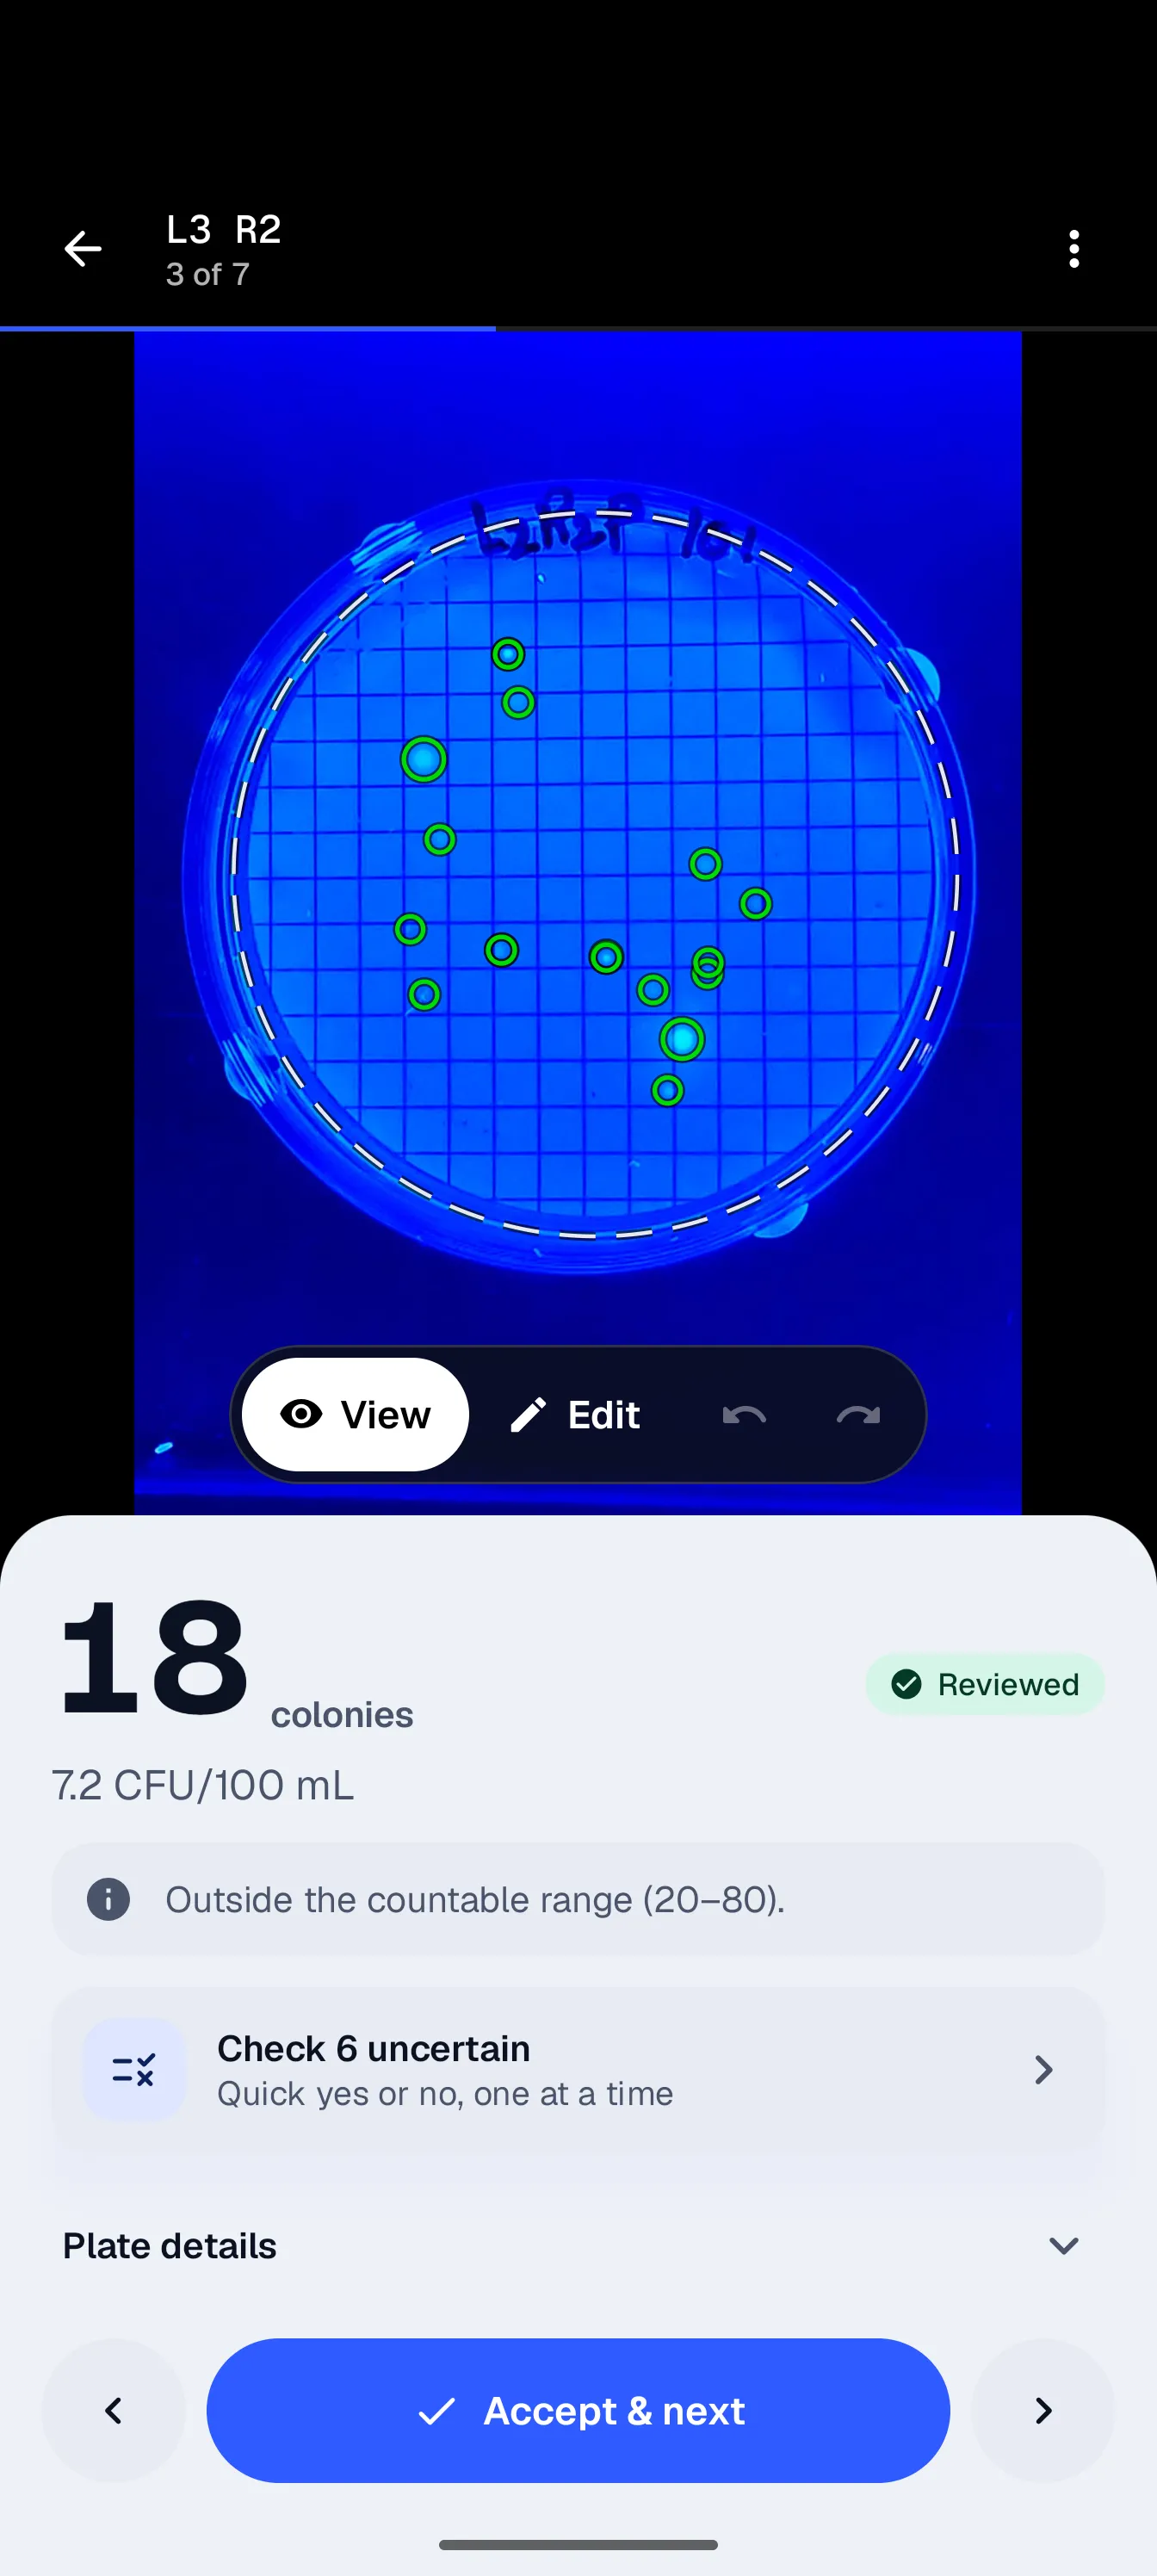
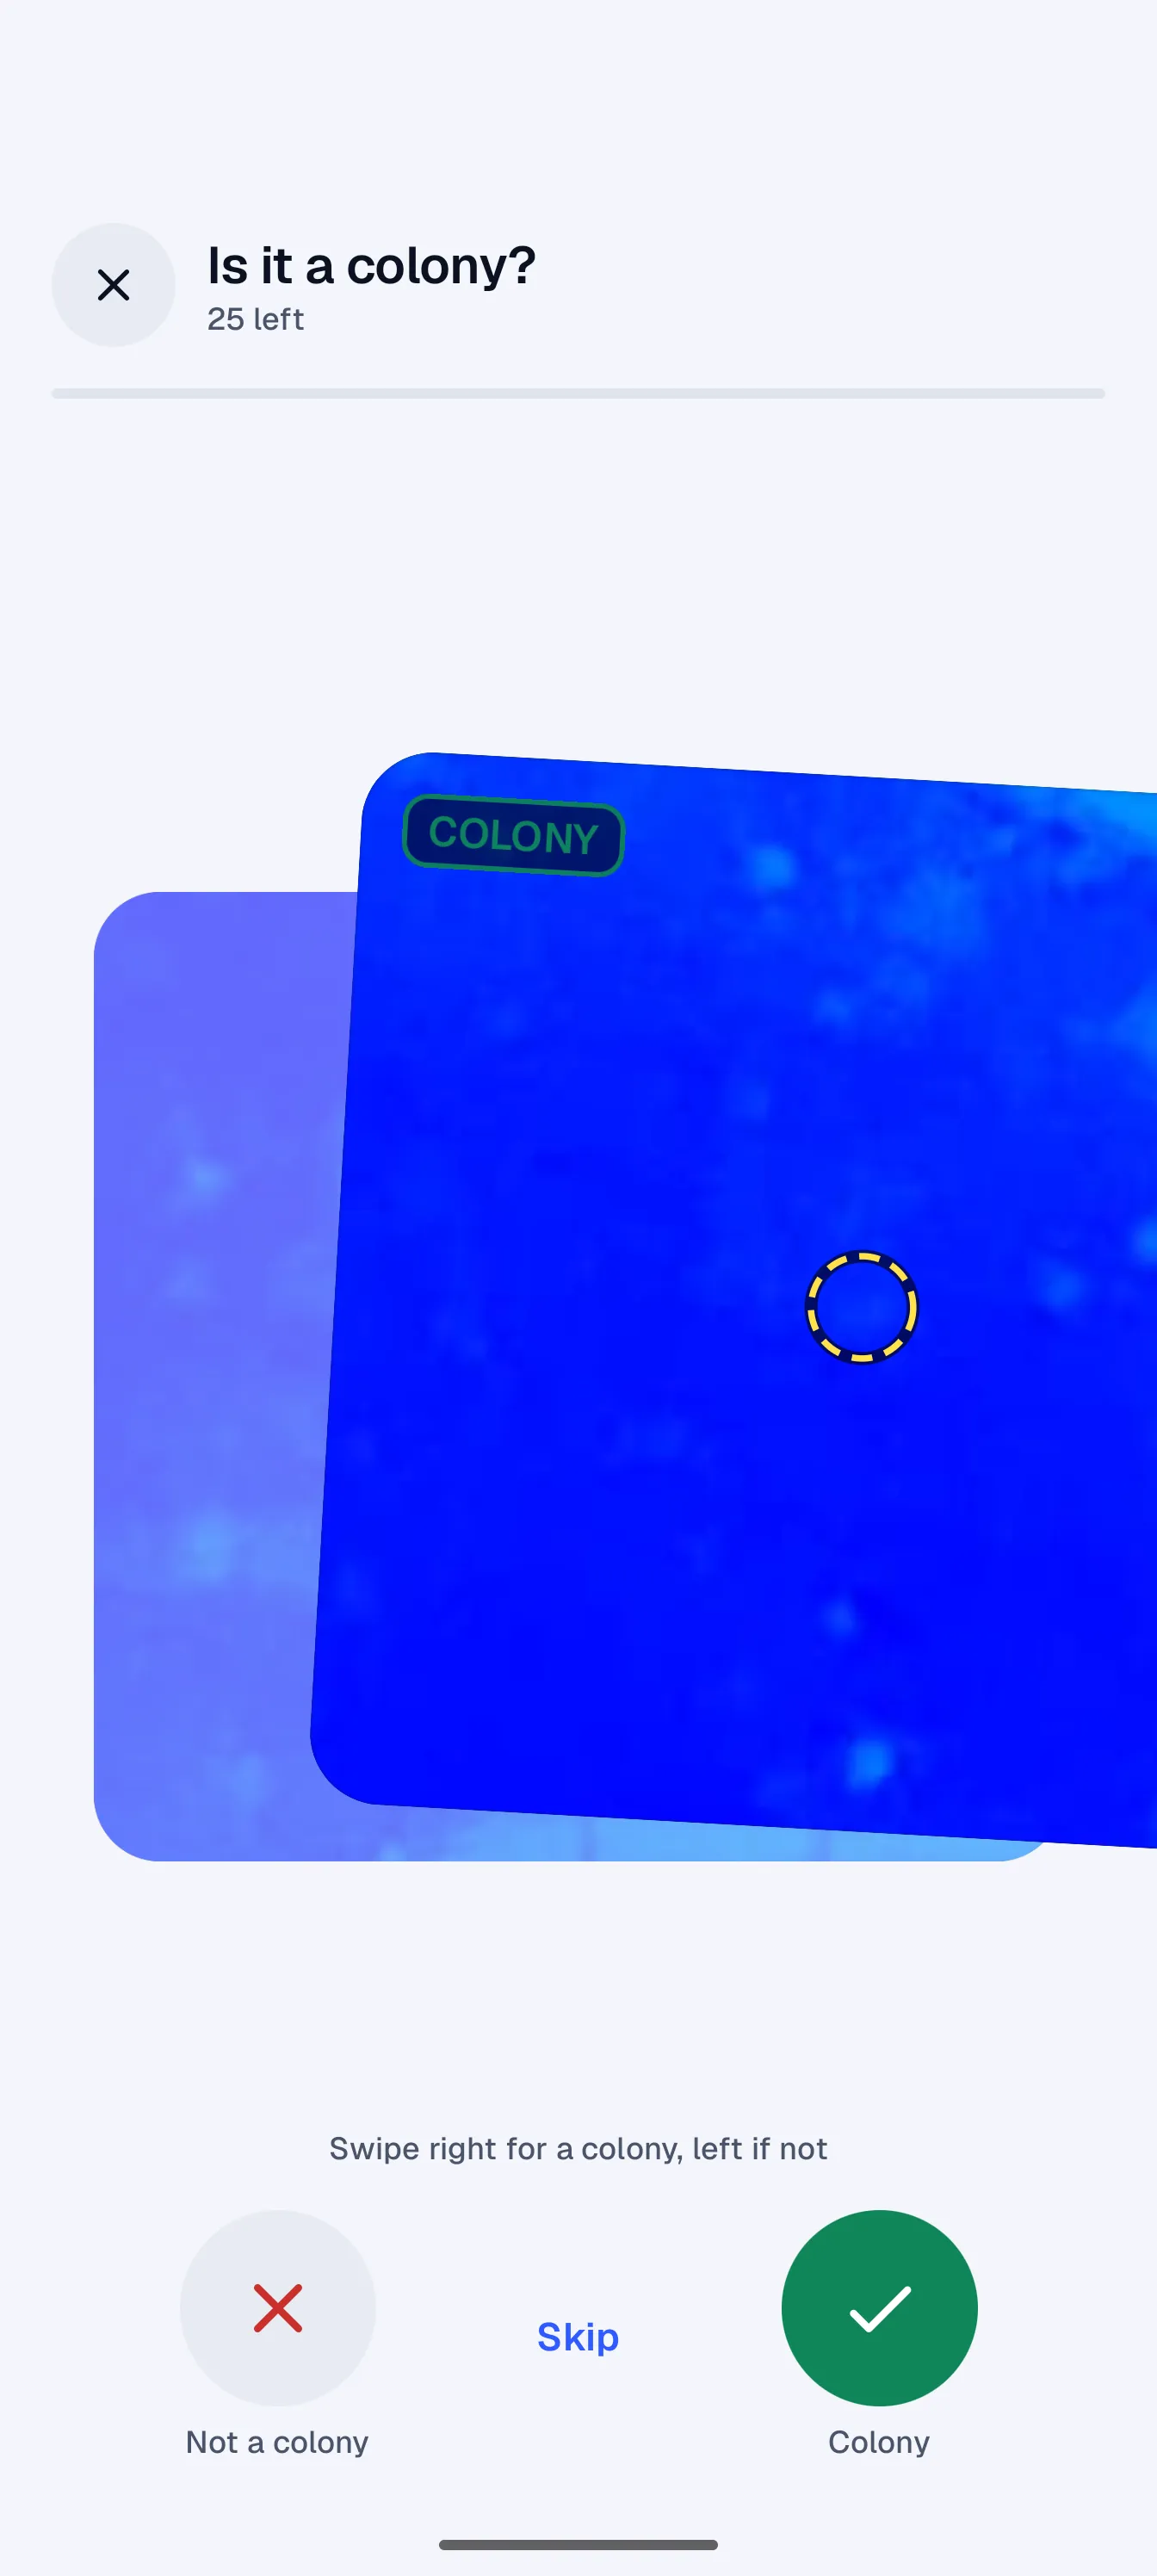
You photograph a plate or share photos in from elsewhere, check the count, correct it if needed and export results per plate or per sample. The app works out CFU from the dilution. It all runs on the phone with no connection.
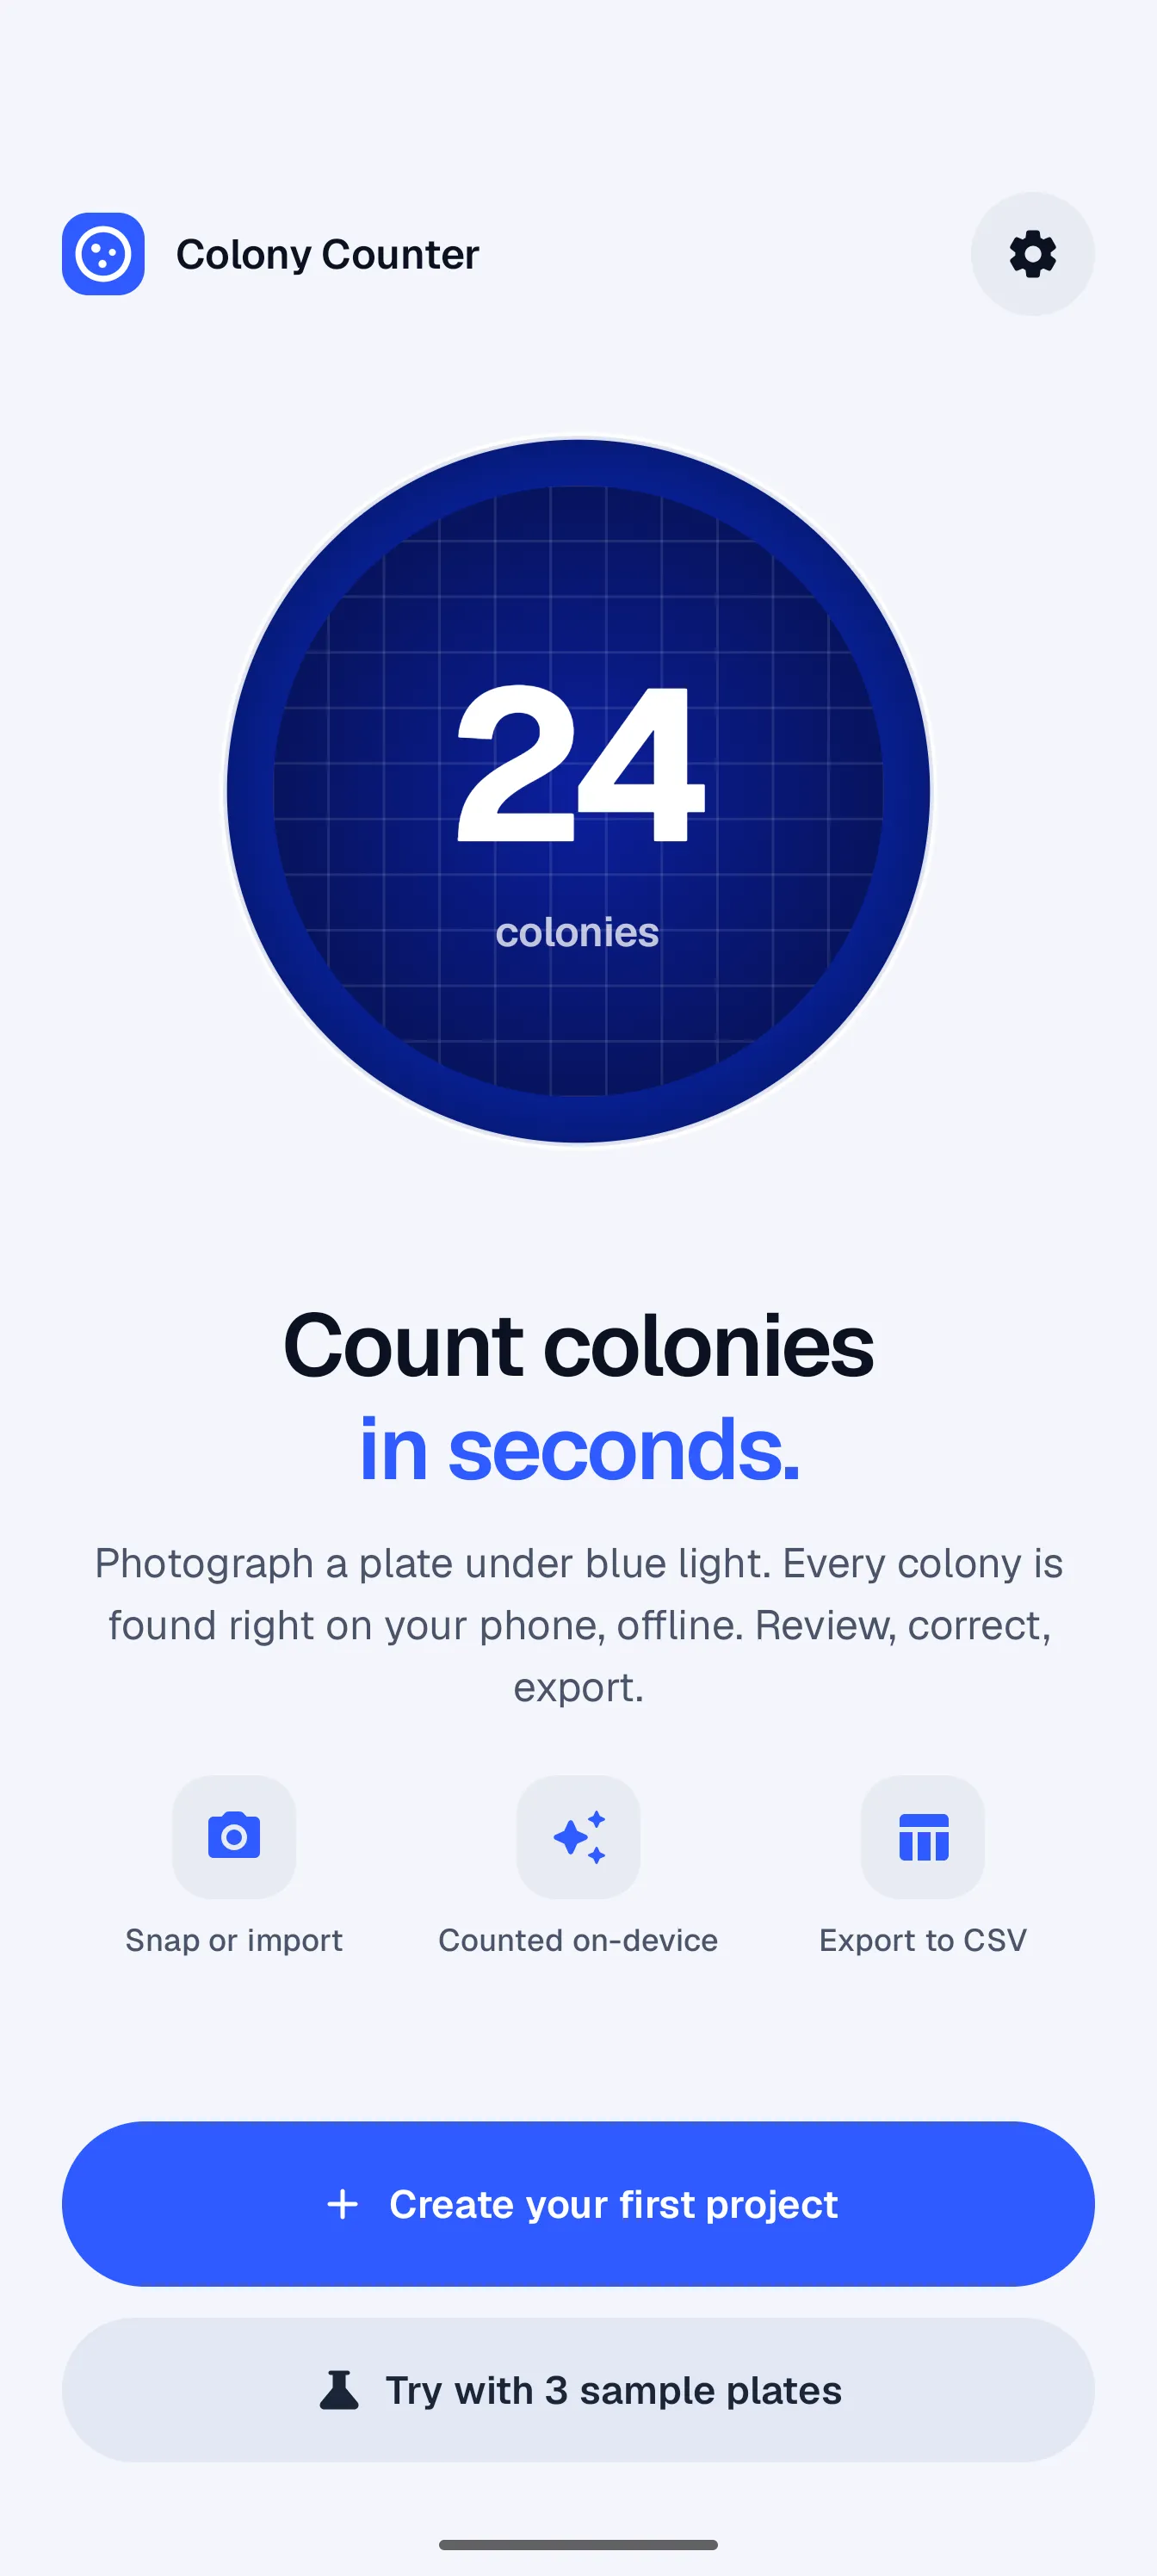
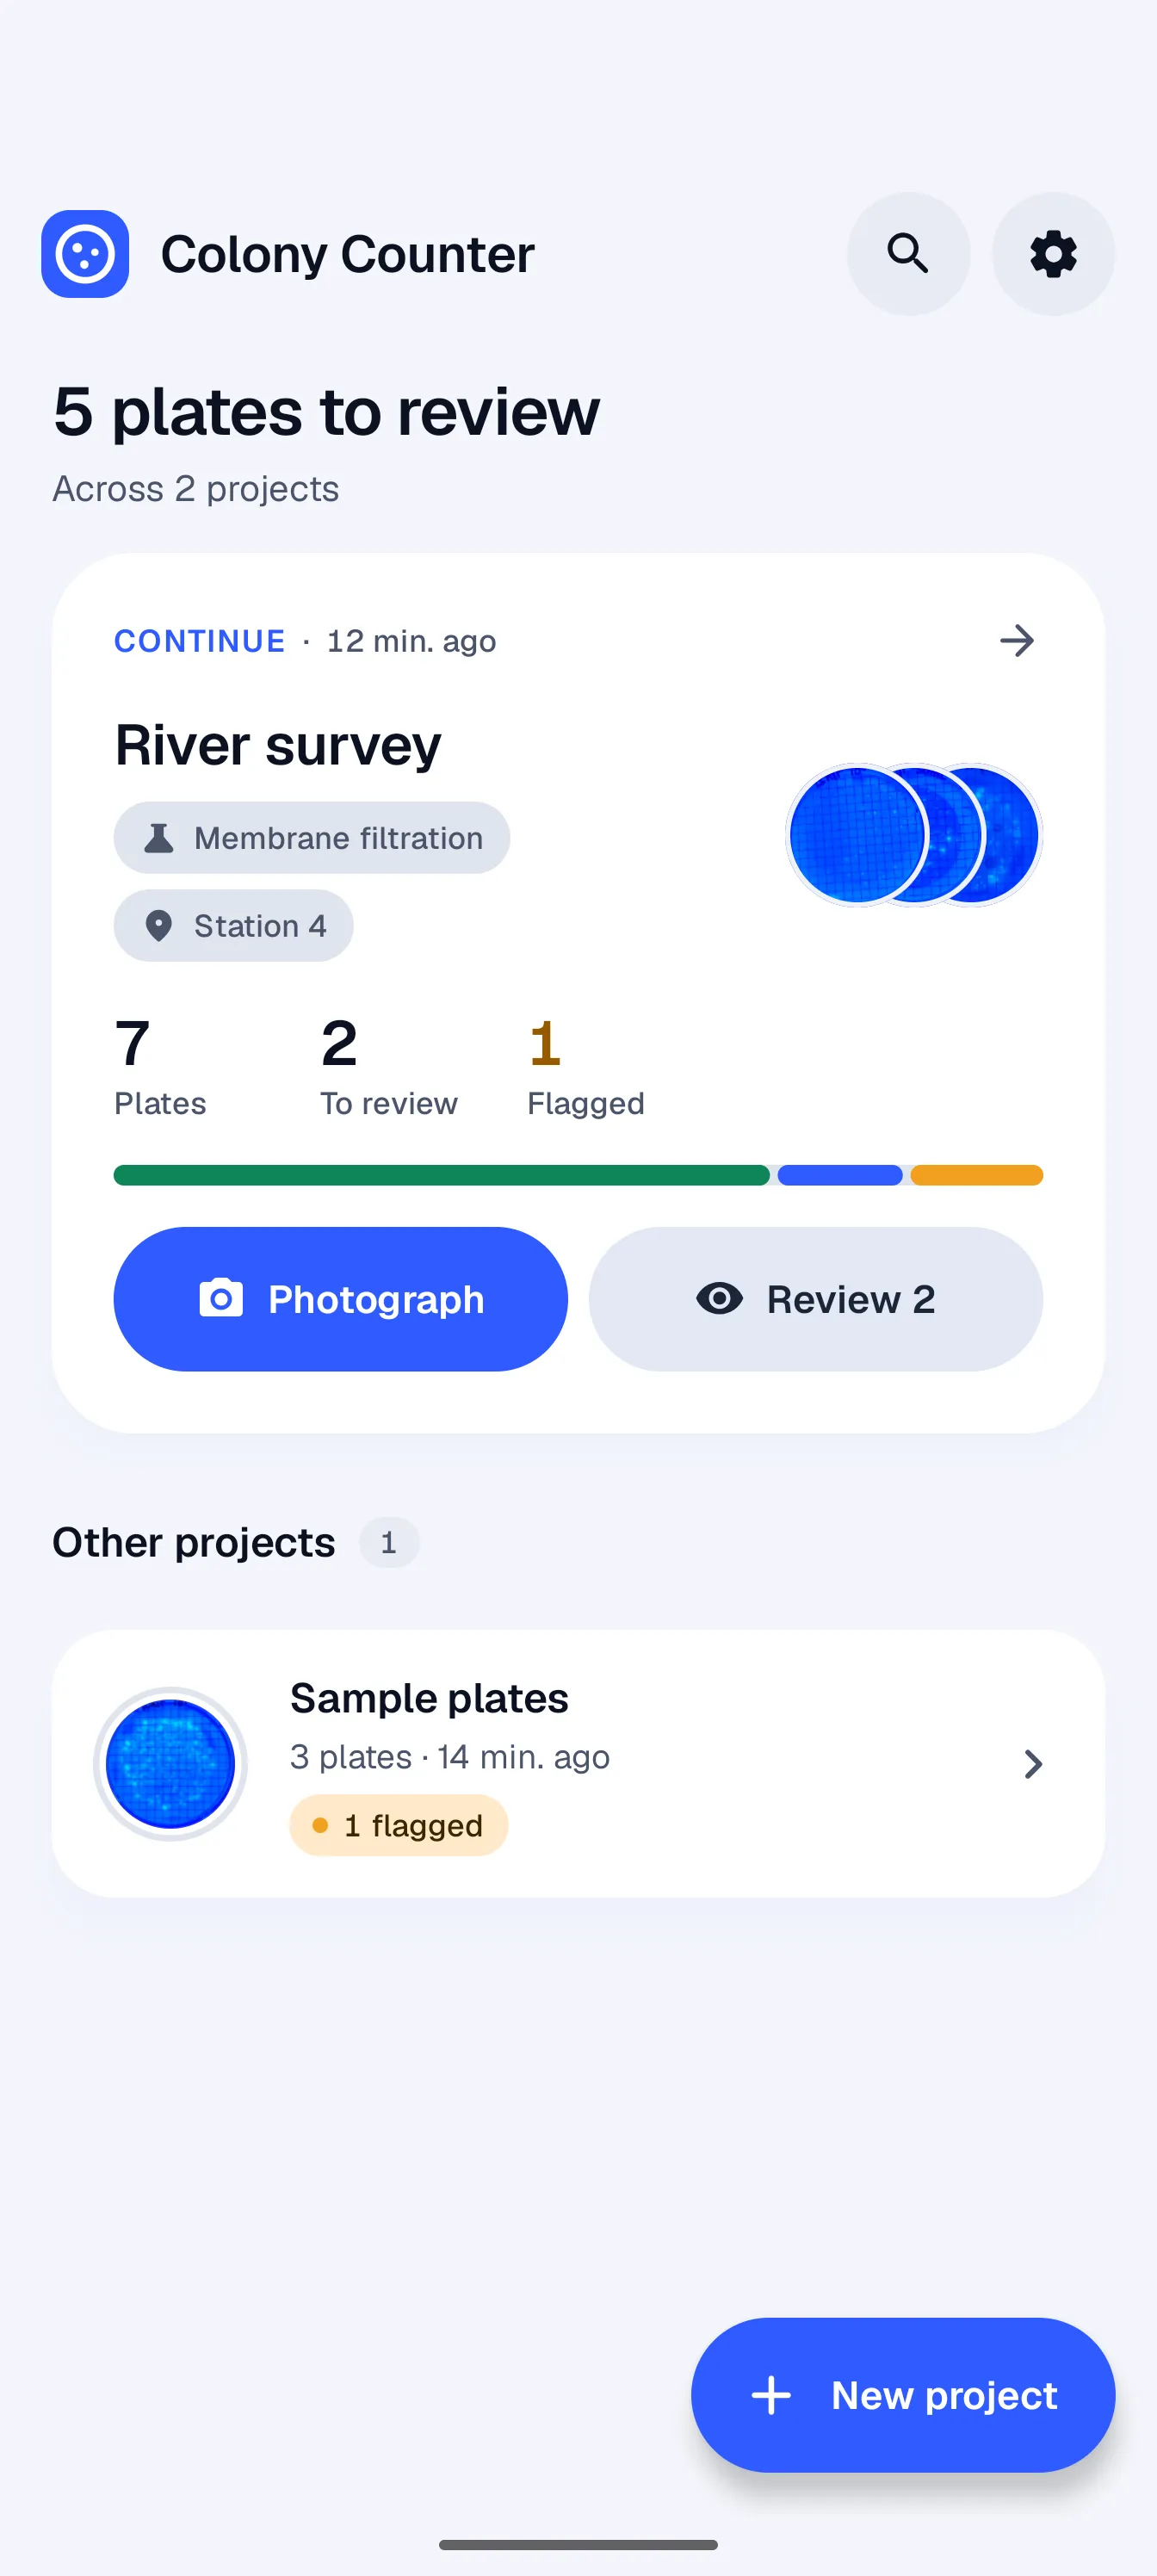
Home
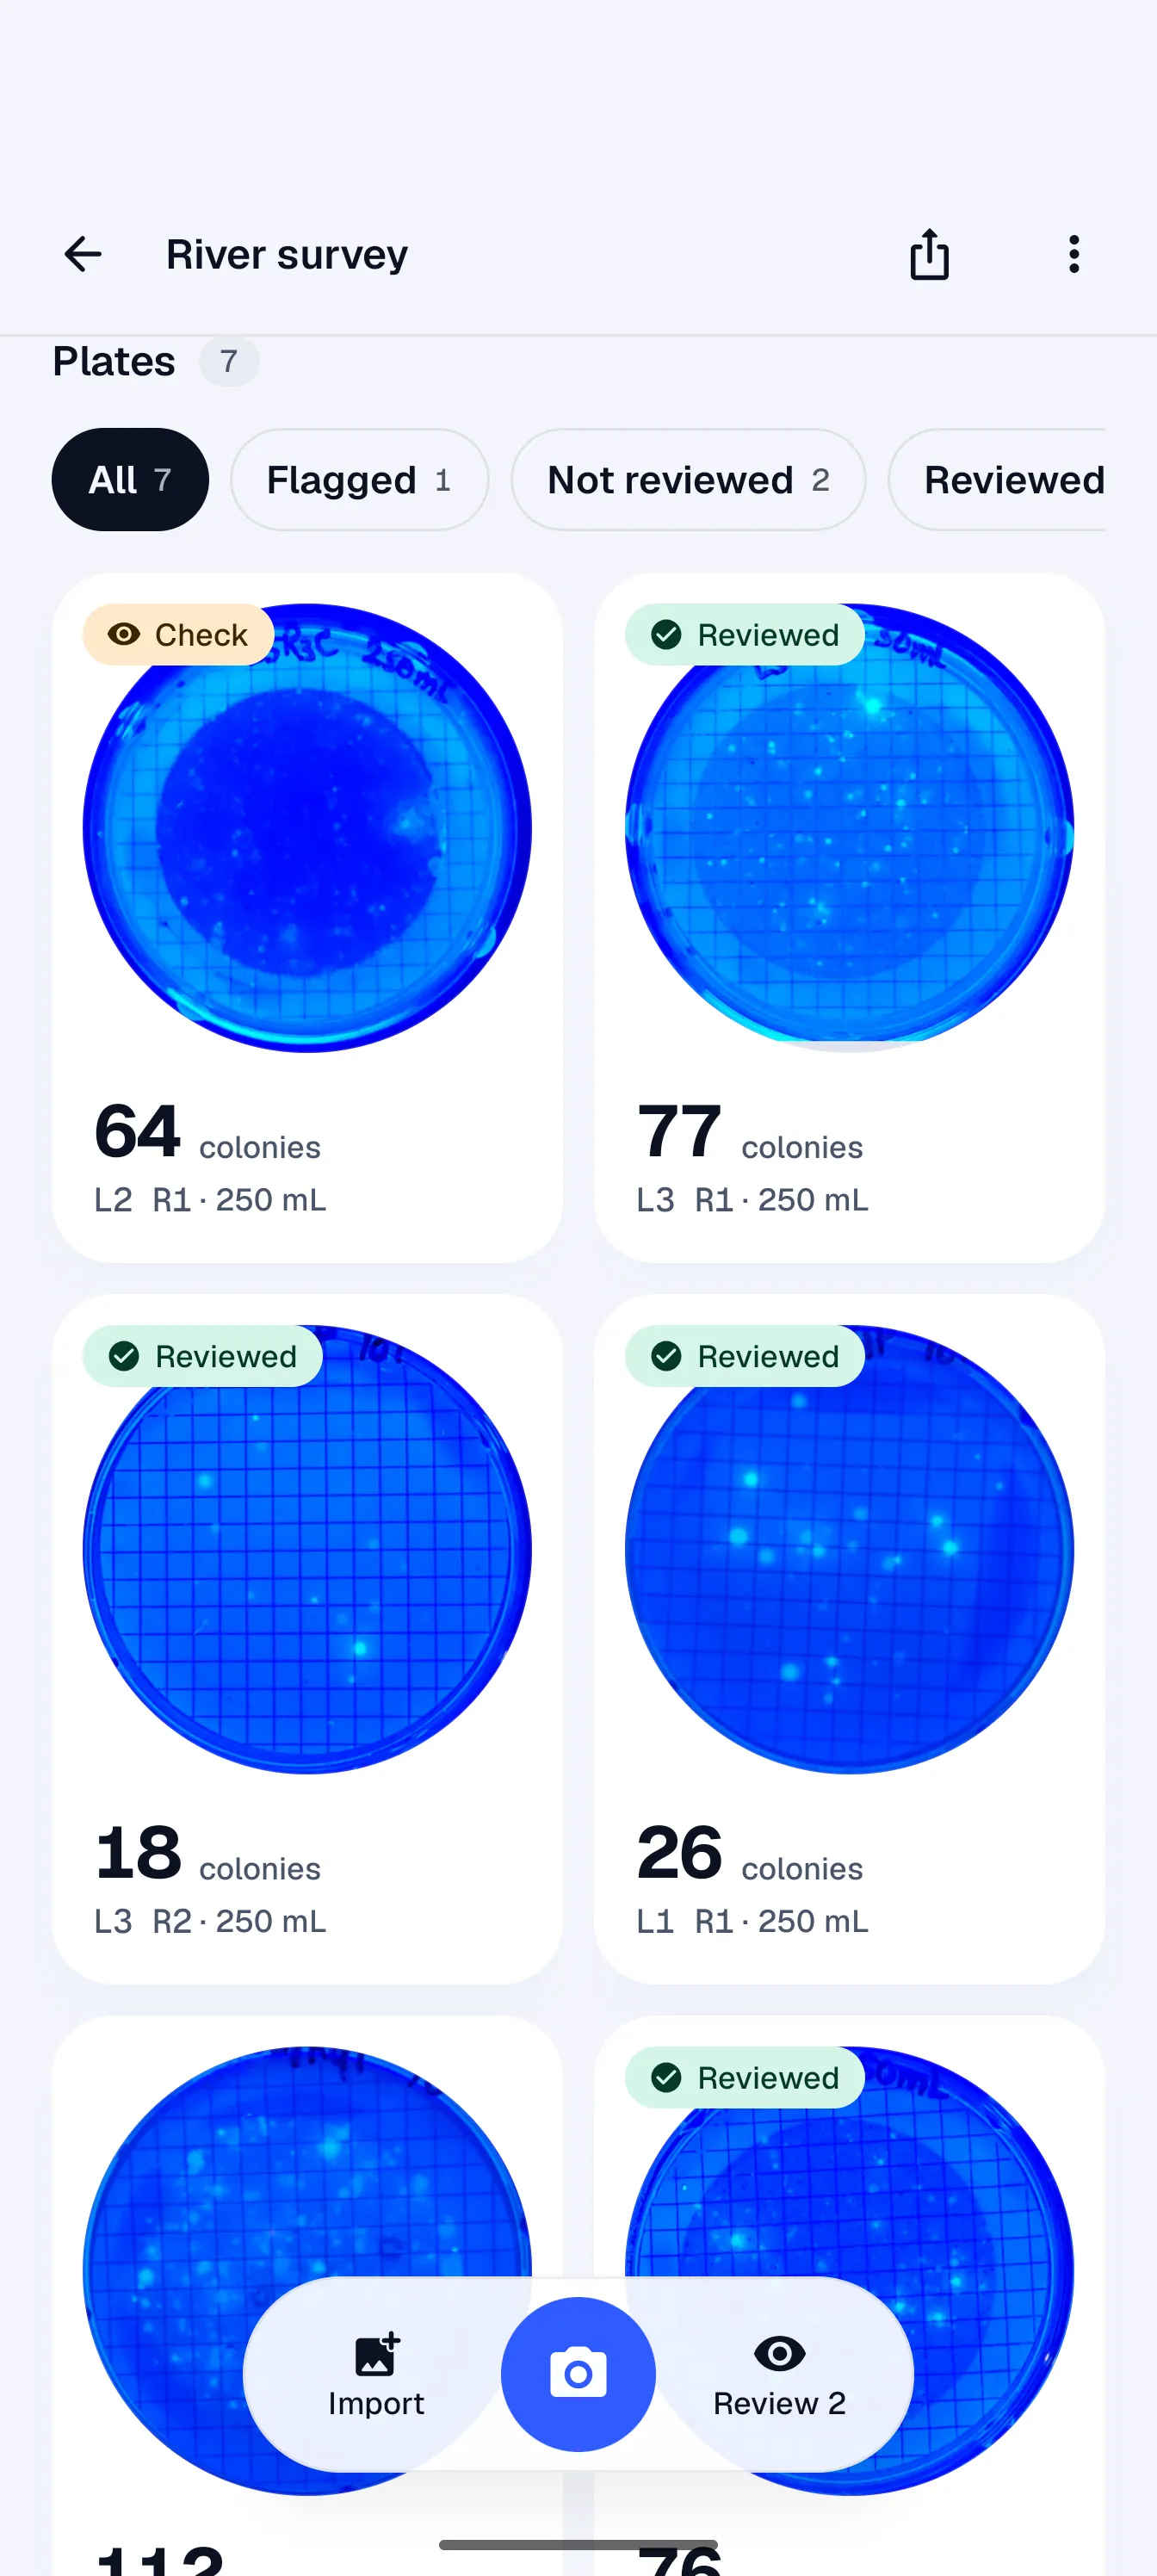
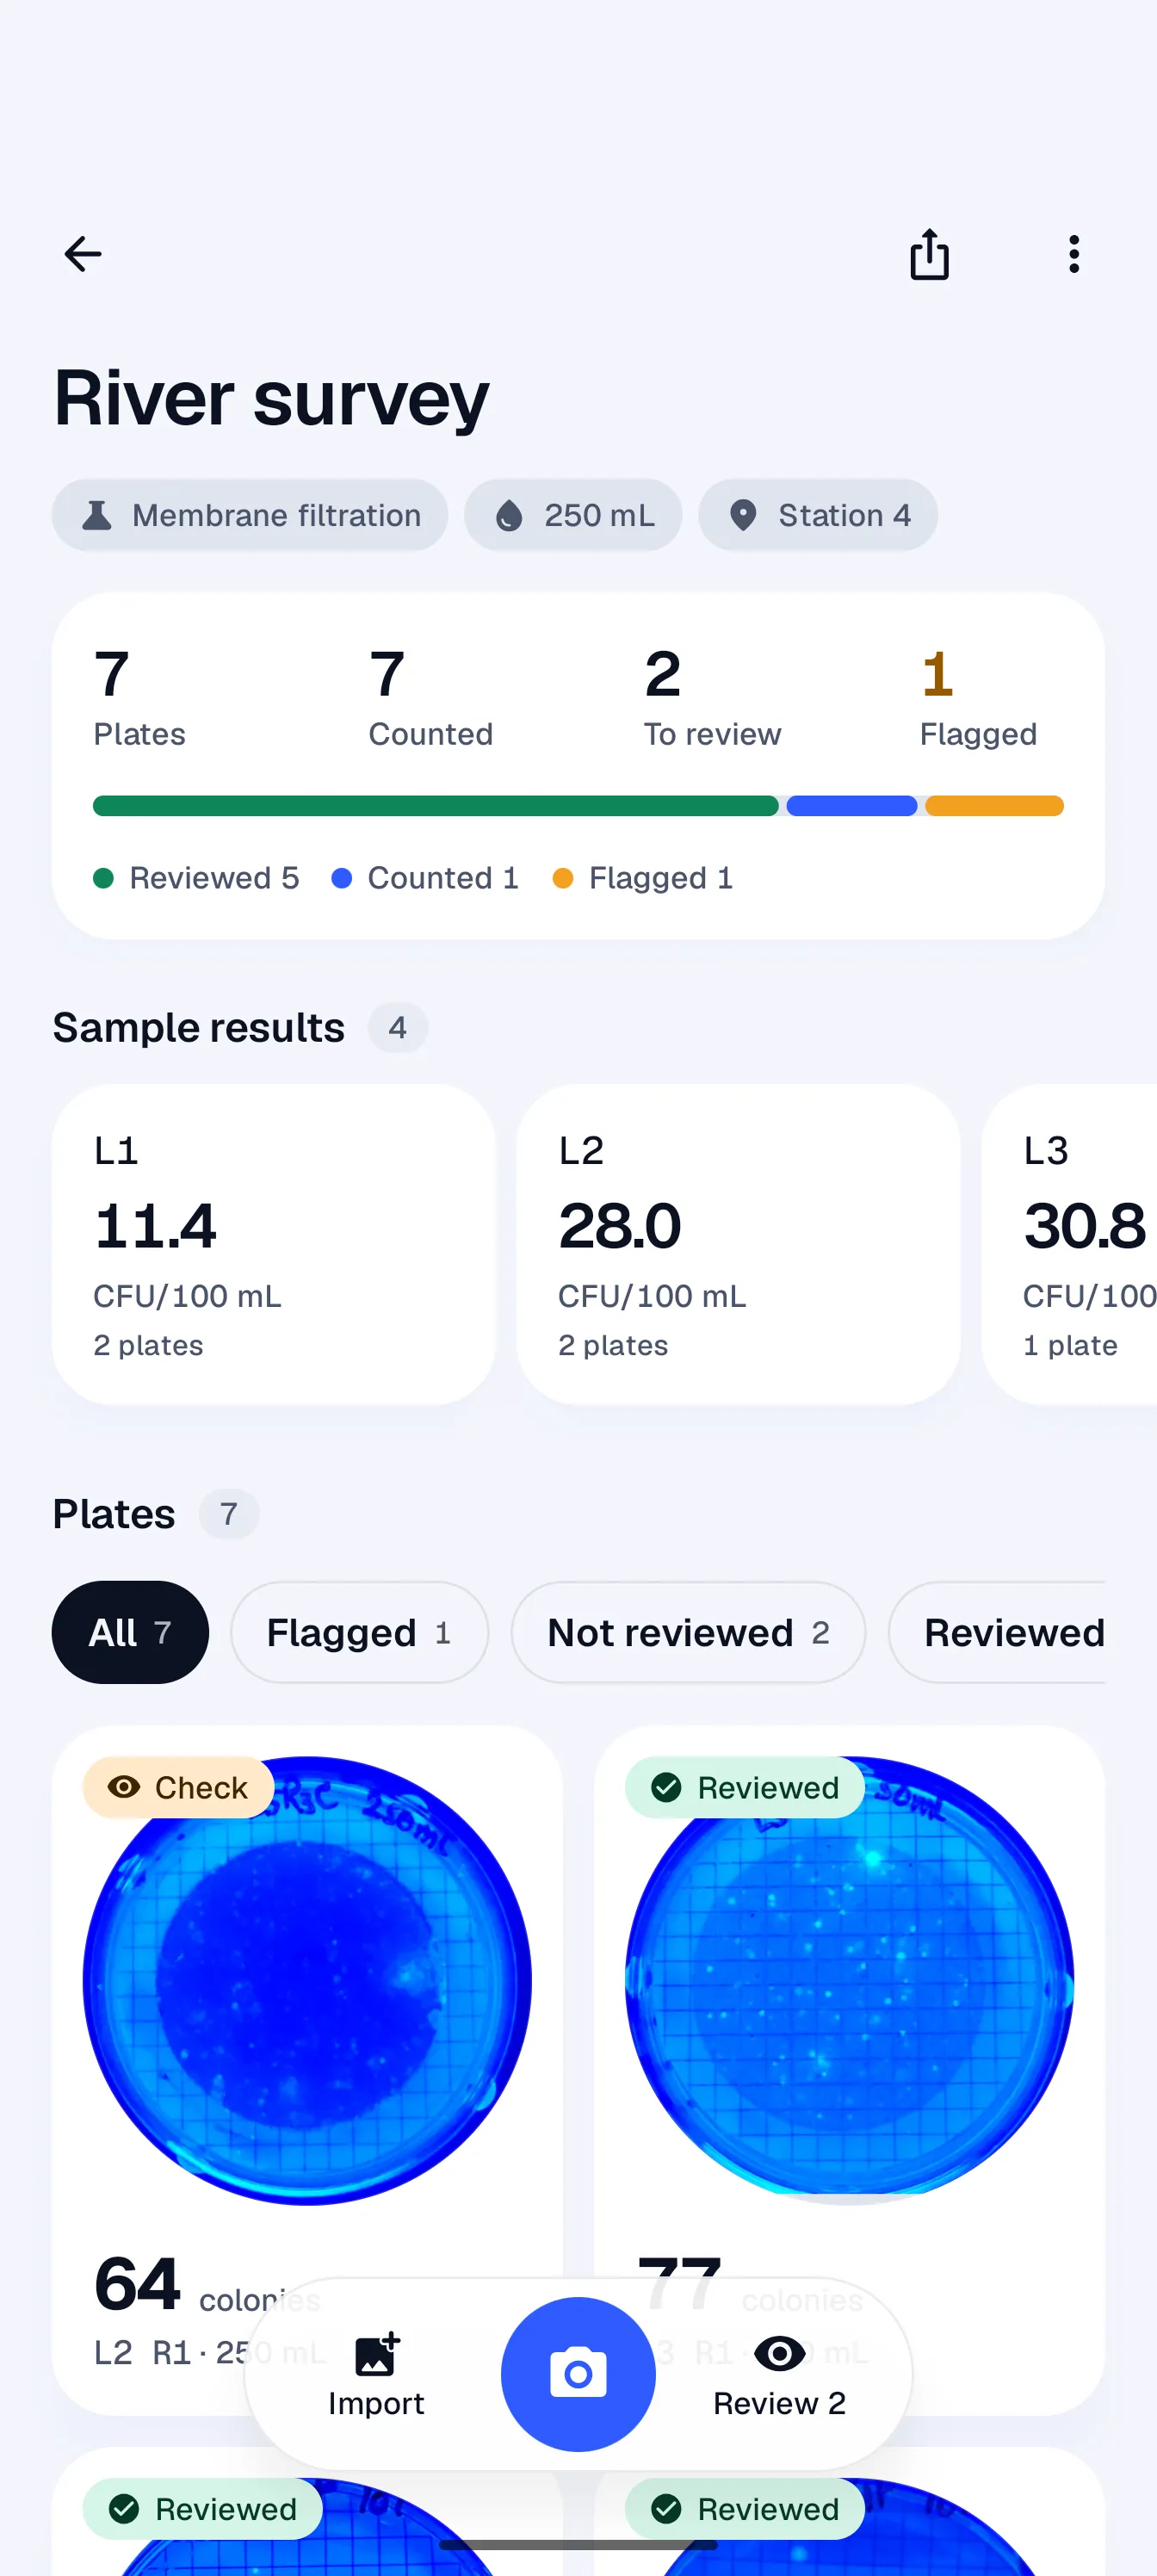
A project
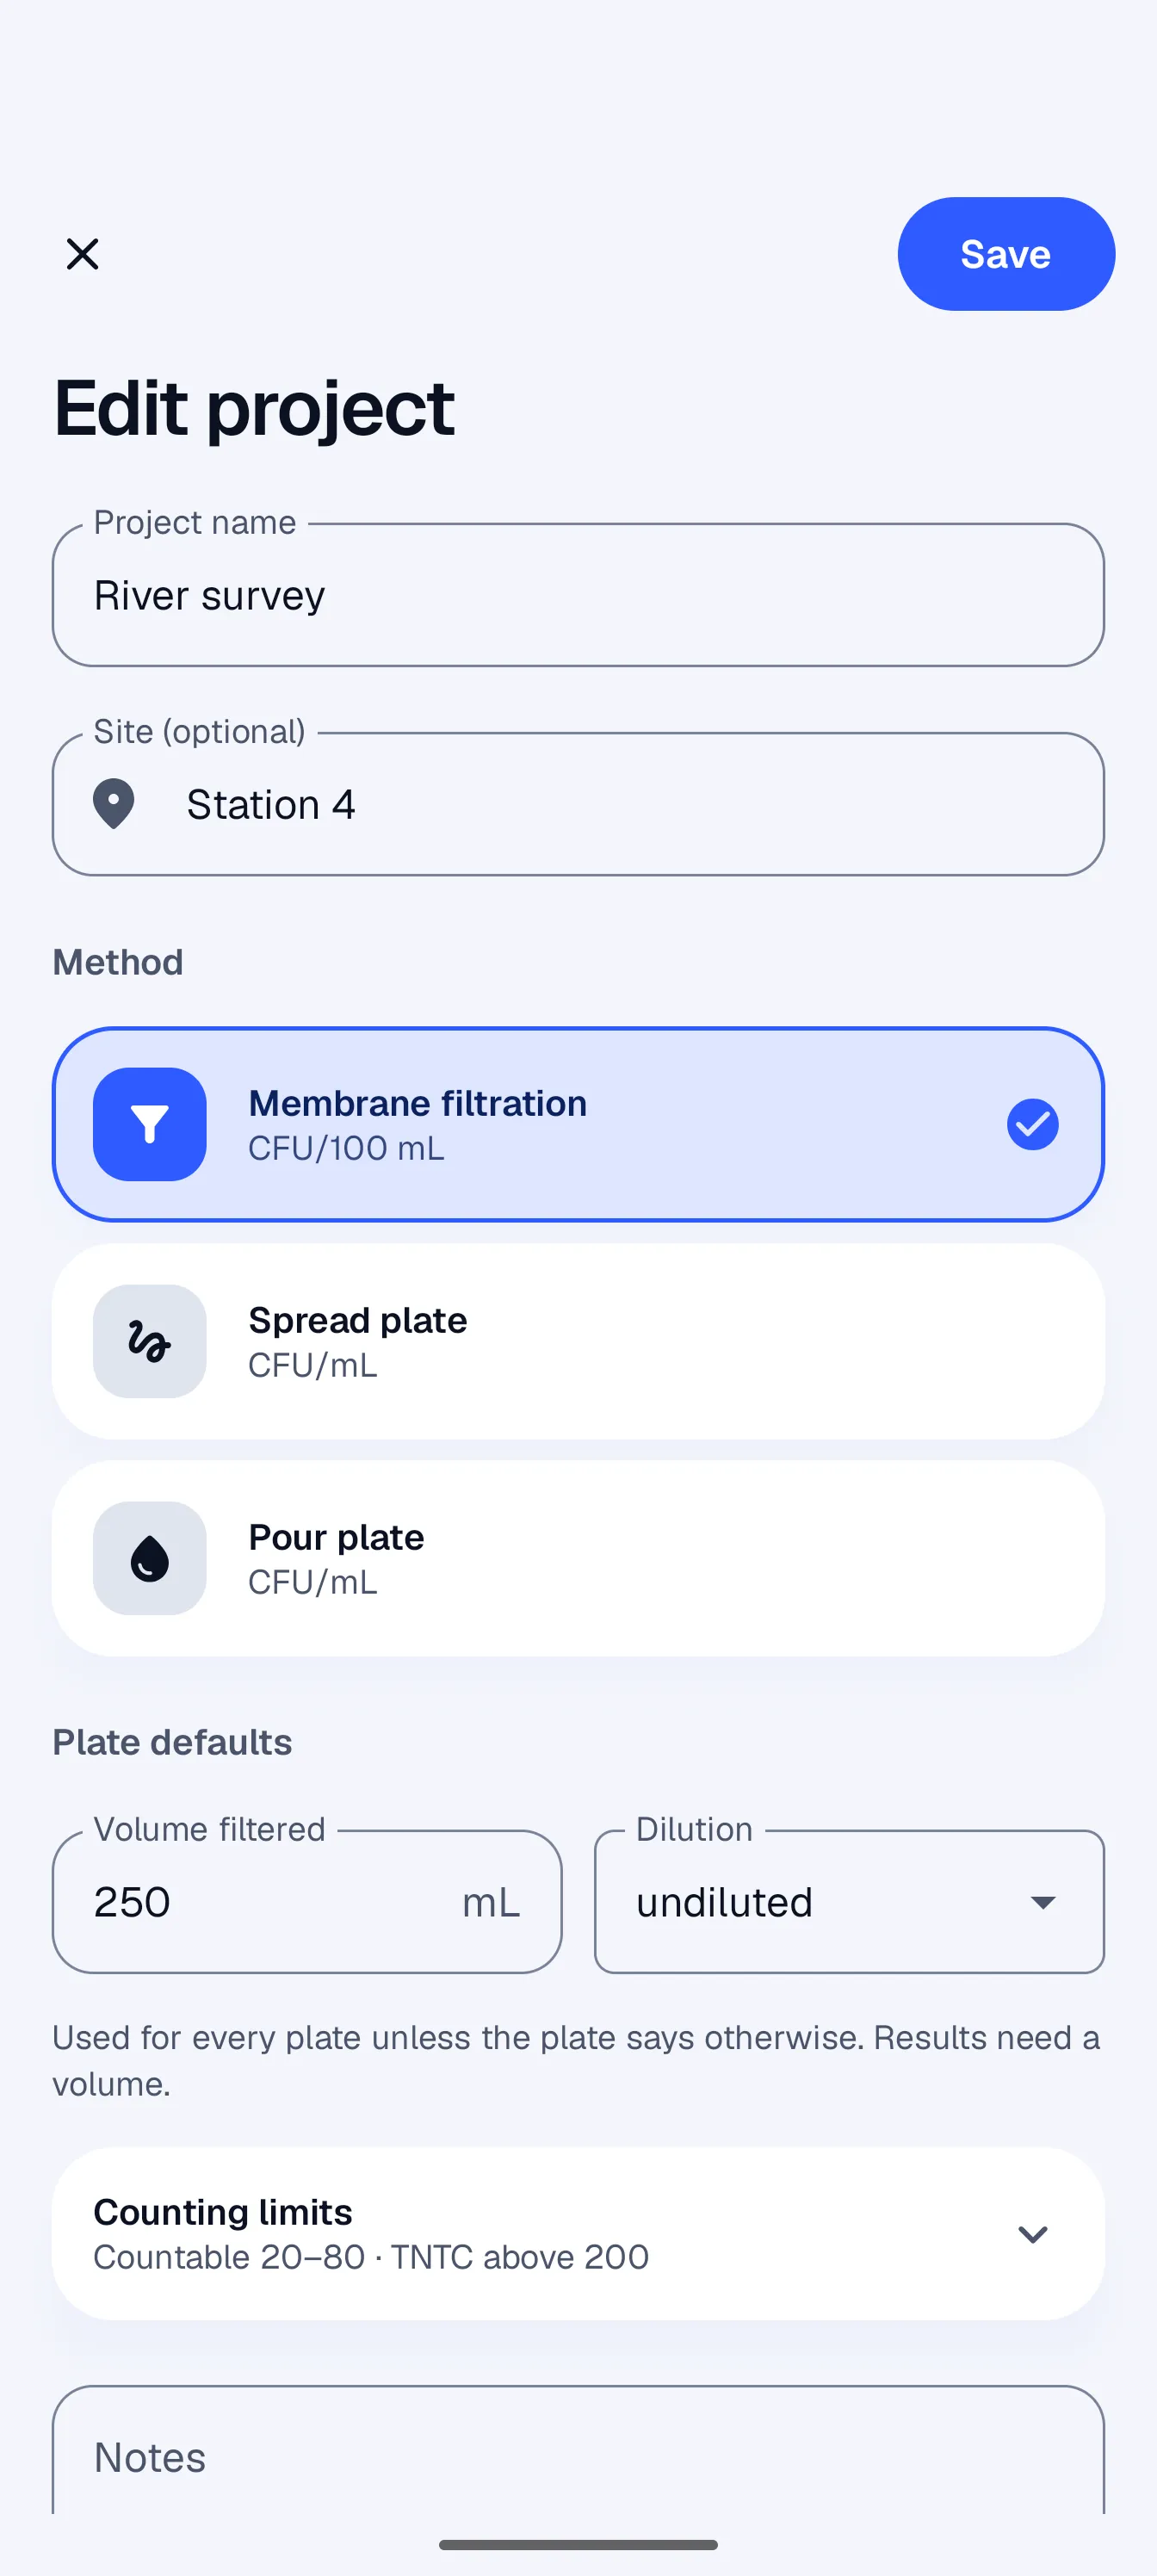
Method
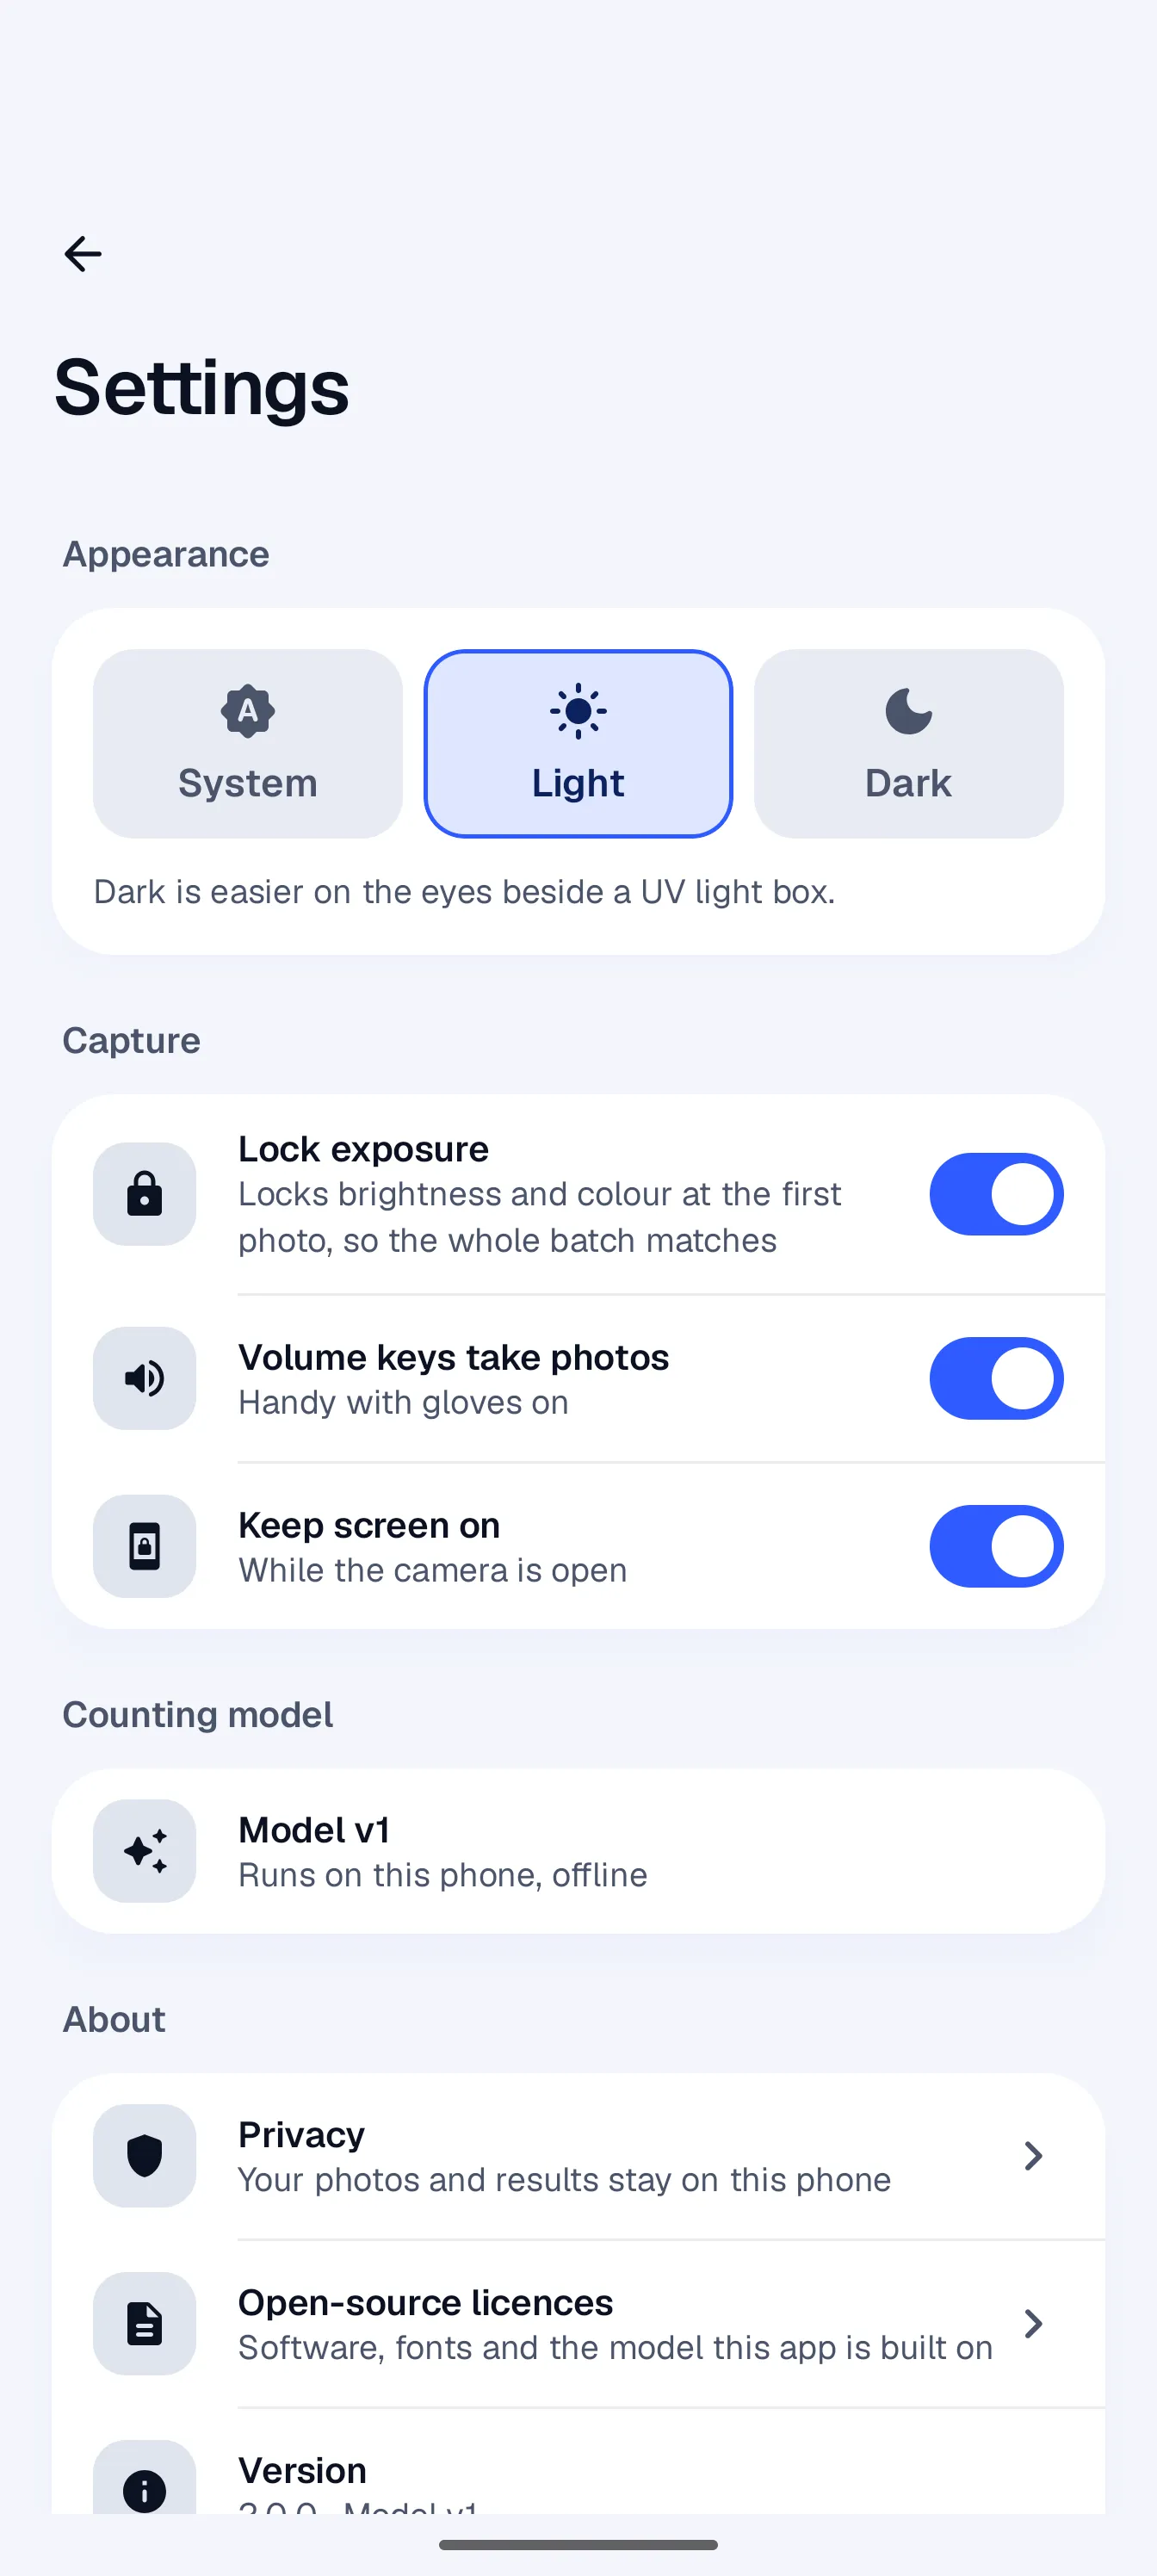
Settings
The app in its light theme. Set the method and dilution once, and each sample's result comes out in CFU per 100 mL.
Thresholds first
My first version used classical computer vision in OpenCV. It corrected for uneven lighting, picked out bright spots and split touching colonies with a watershed. On the first 16 plates it looked fine.
The next batch of 199 plates broke it. On 80 of them, the mask meant to hide the marker label spread over most of the dish, and bright rings at the dish edge turned into colonies. I got the floods down from 80 plates to 8. Faint colonies on dark sediment plates never came out, though. Any threshold low enough to catch them also caught the grid.
Two models
In September 2026 I rebuilt it. Version 1 uses two YOLO26 models. The first finds the dish in the photo. The second counts colonies on a crop of the dish at 1024 pixels, so a colony 16 pixels wide in the photo is still 16 pixels wide when the model sees it. My July model looked at the whole photo at 640 pixels, which shrank colonies to about 6.
Both models run on the phone with ONNX Runtime. The app crops each photo with exactly the same integer arithmetic as the Python code. A test on real plates checks that the phone and my laptop agree. All 16 test plates gave the laptop’s count to the colony. The release build counted those 16 plates in 11.8 seconds on my Pixel 9 Pro XL, which is 0.74 seconds a plate with model loading included.
Results
I froze a test set of 16 plates before training. Neither detector saw them during tuning.
Detector
Mean absolute error (colonies per plate)
Plates within 5 colonies or 10%
Version 1 model
16.6
50%
OpenCV detector
25.7
31%
Sixteen plates is a small test. The 95% bootstrap interval for the model’s error runs from 6.7 to 29.9 colonies. A difference under about 5 colonies wouldn’t mean much.
What it gets wrong
Faint colonies on dark sediment discs. On one test plate with 115 labelled colonies the model found 17. Part of that is my labels: on some sediment plates every faint speck is marked, and on others none are. For now the app flags plates like this for a manual check. Across all plates it undercounts by about 11 colonies.
Next
Once I have answers I’ll relabel the affected plates and finish correcting the ones the model pre-labelled. Then I’ll retrain and score the new model on the same 16 test plates, so the numbers compare with these.
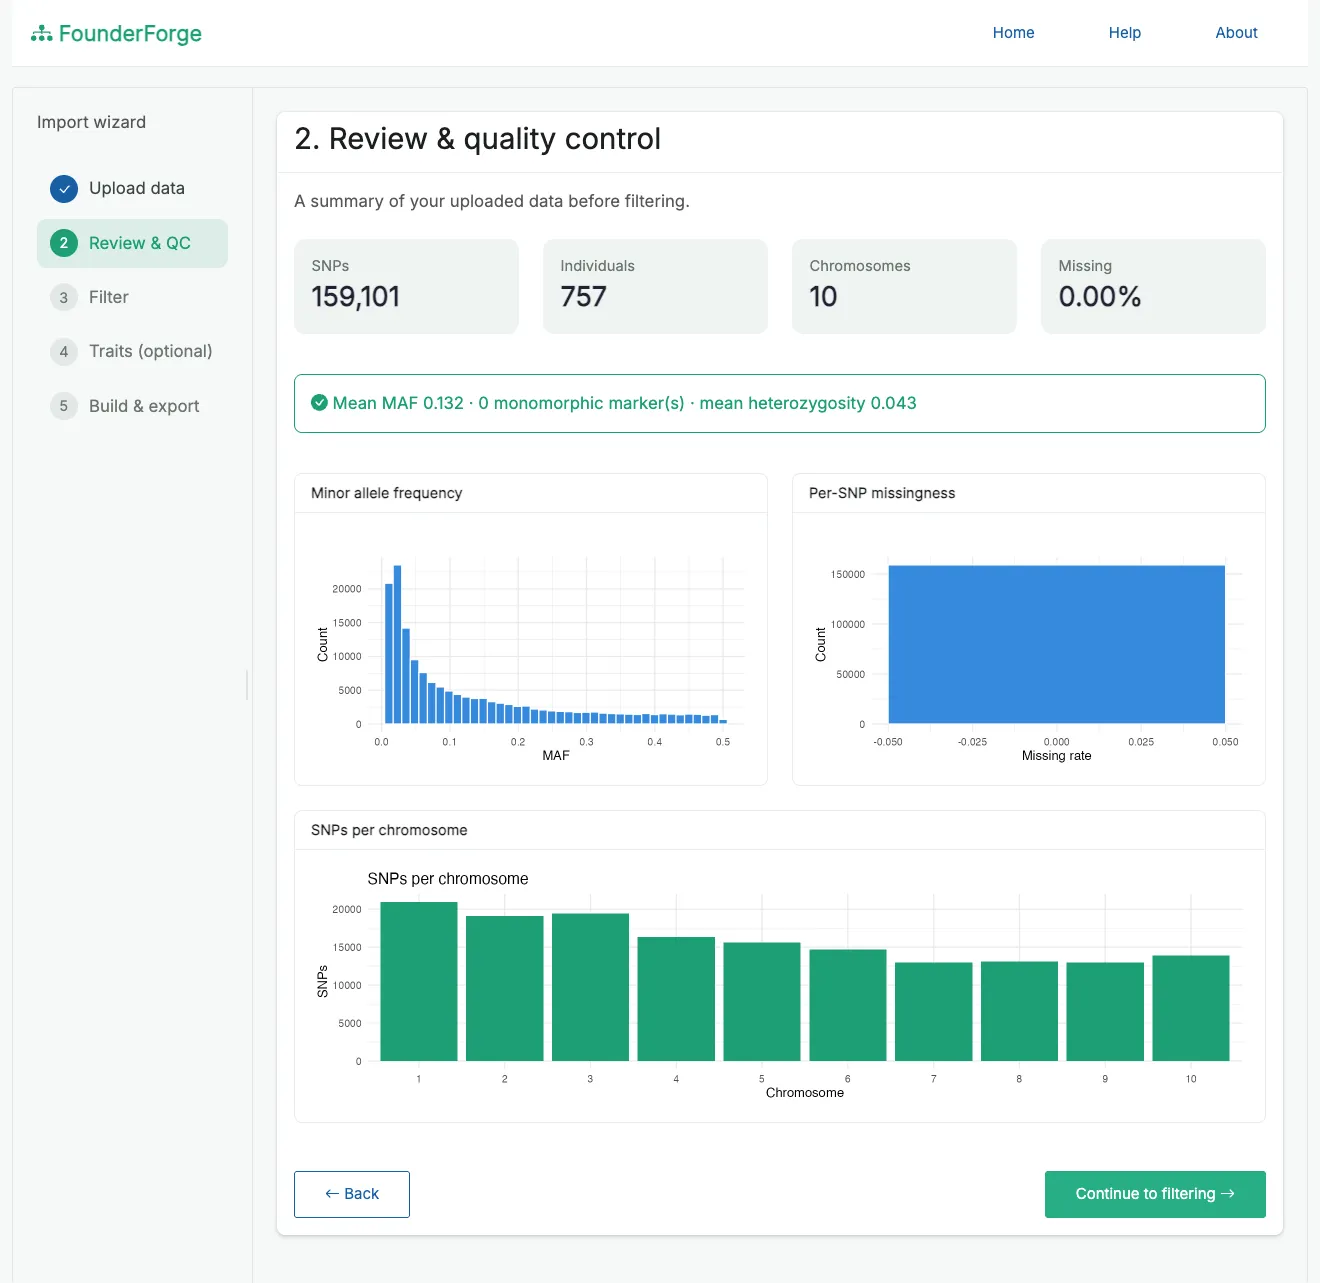
A Shiny app that turns real marker data into an AlphaSimR founder population without writing R. Load a VCF, HapMap, numeric or PLINK file, check it, filter it and export what newMapPop() needs.
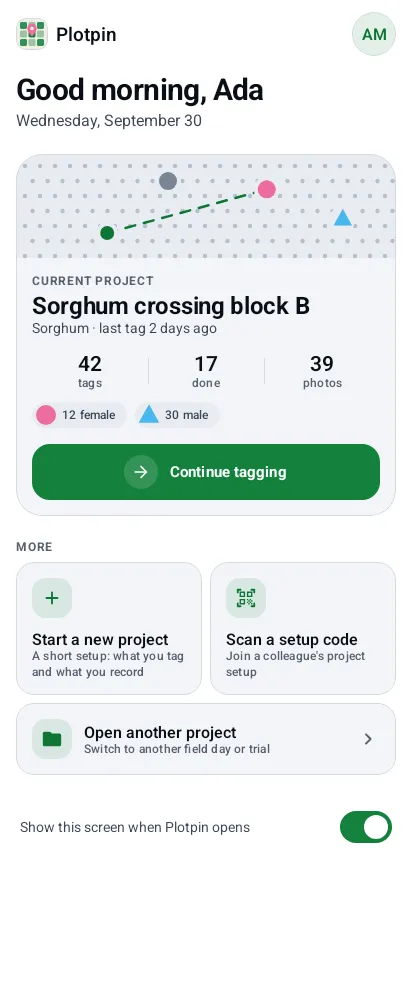
An Android app for finding a plant again. I built it to walk back to bagged sorghum plants in a crossing block. Now it works for anyone who marks points in a field.
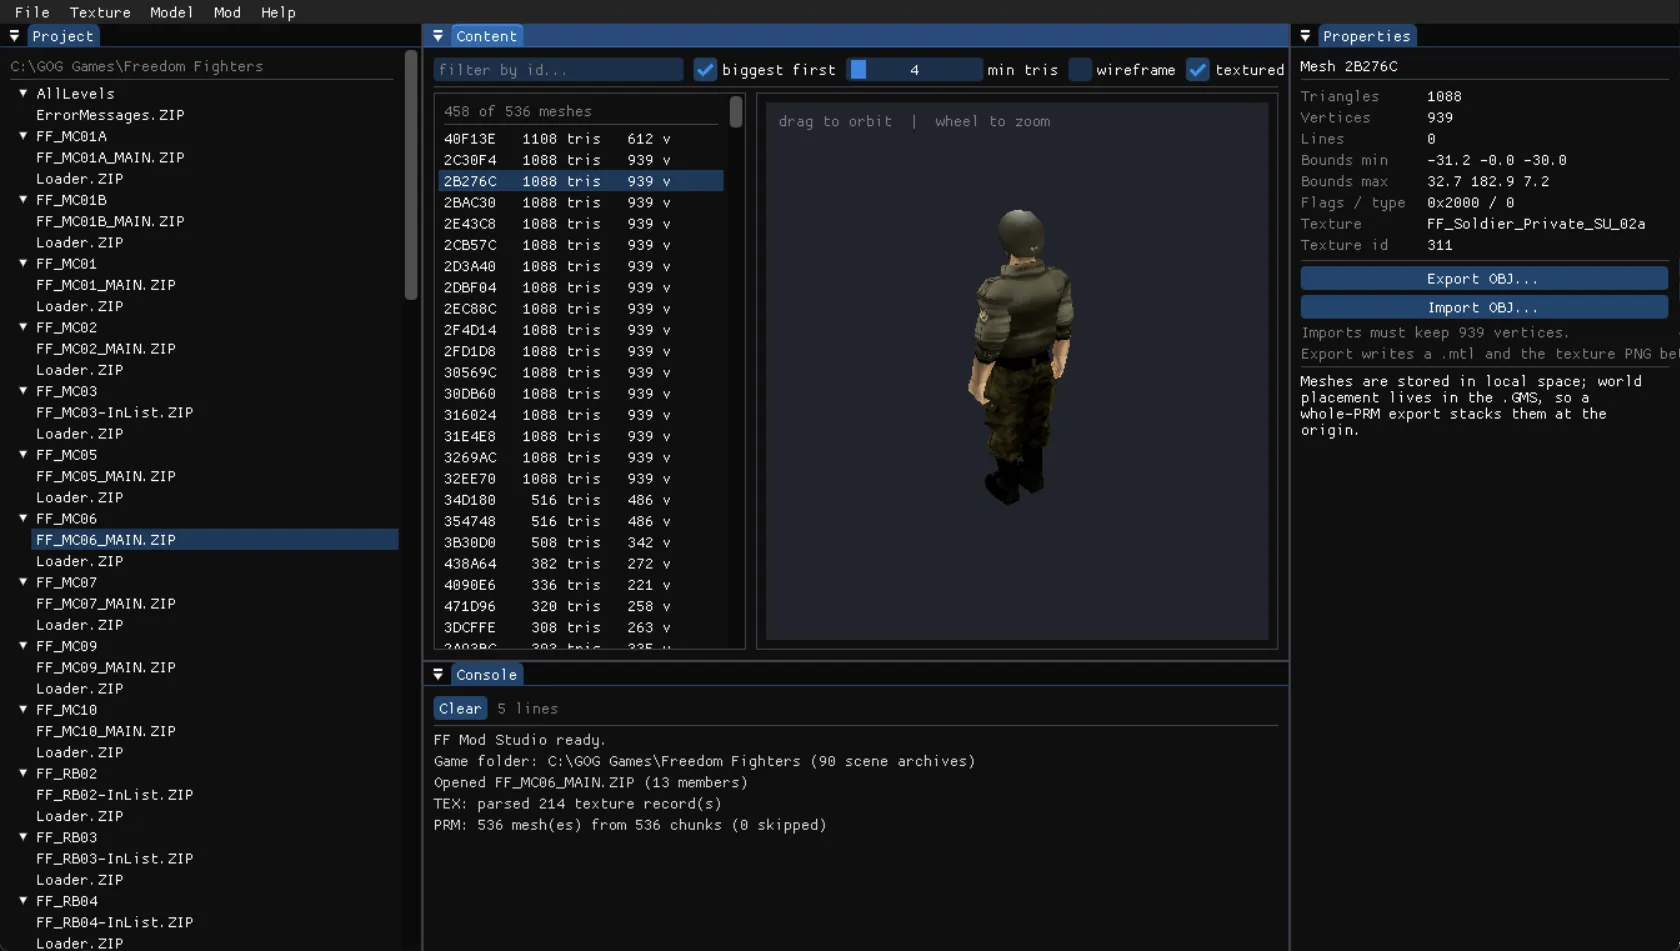
Tools for modding Freedom Fighters, a game from 2003. There's an editor for its textures and models, plus a Blender addon that sends edits back into the game.
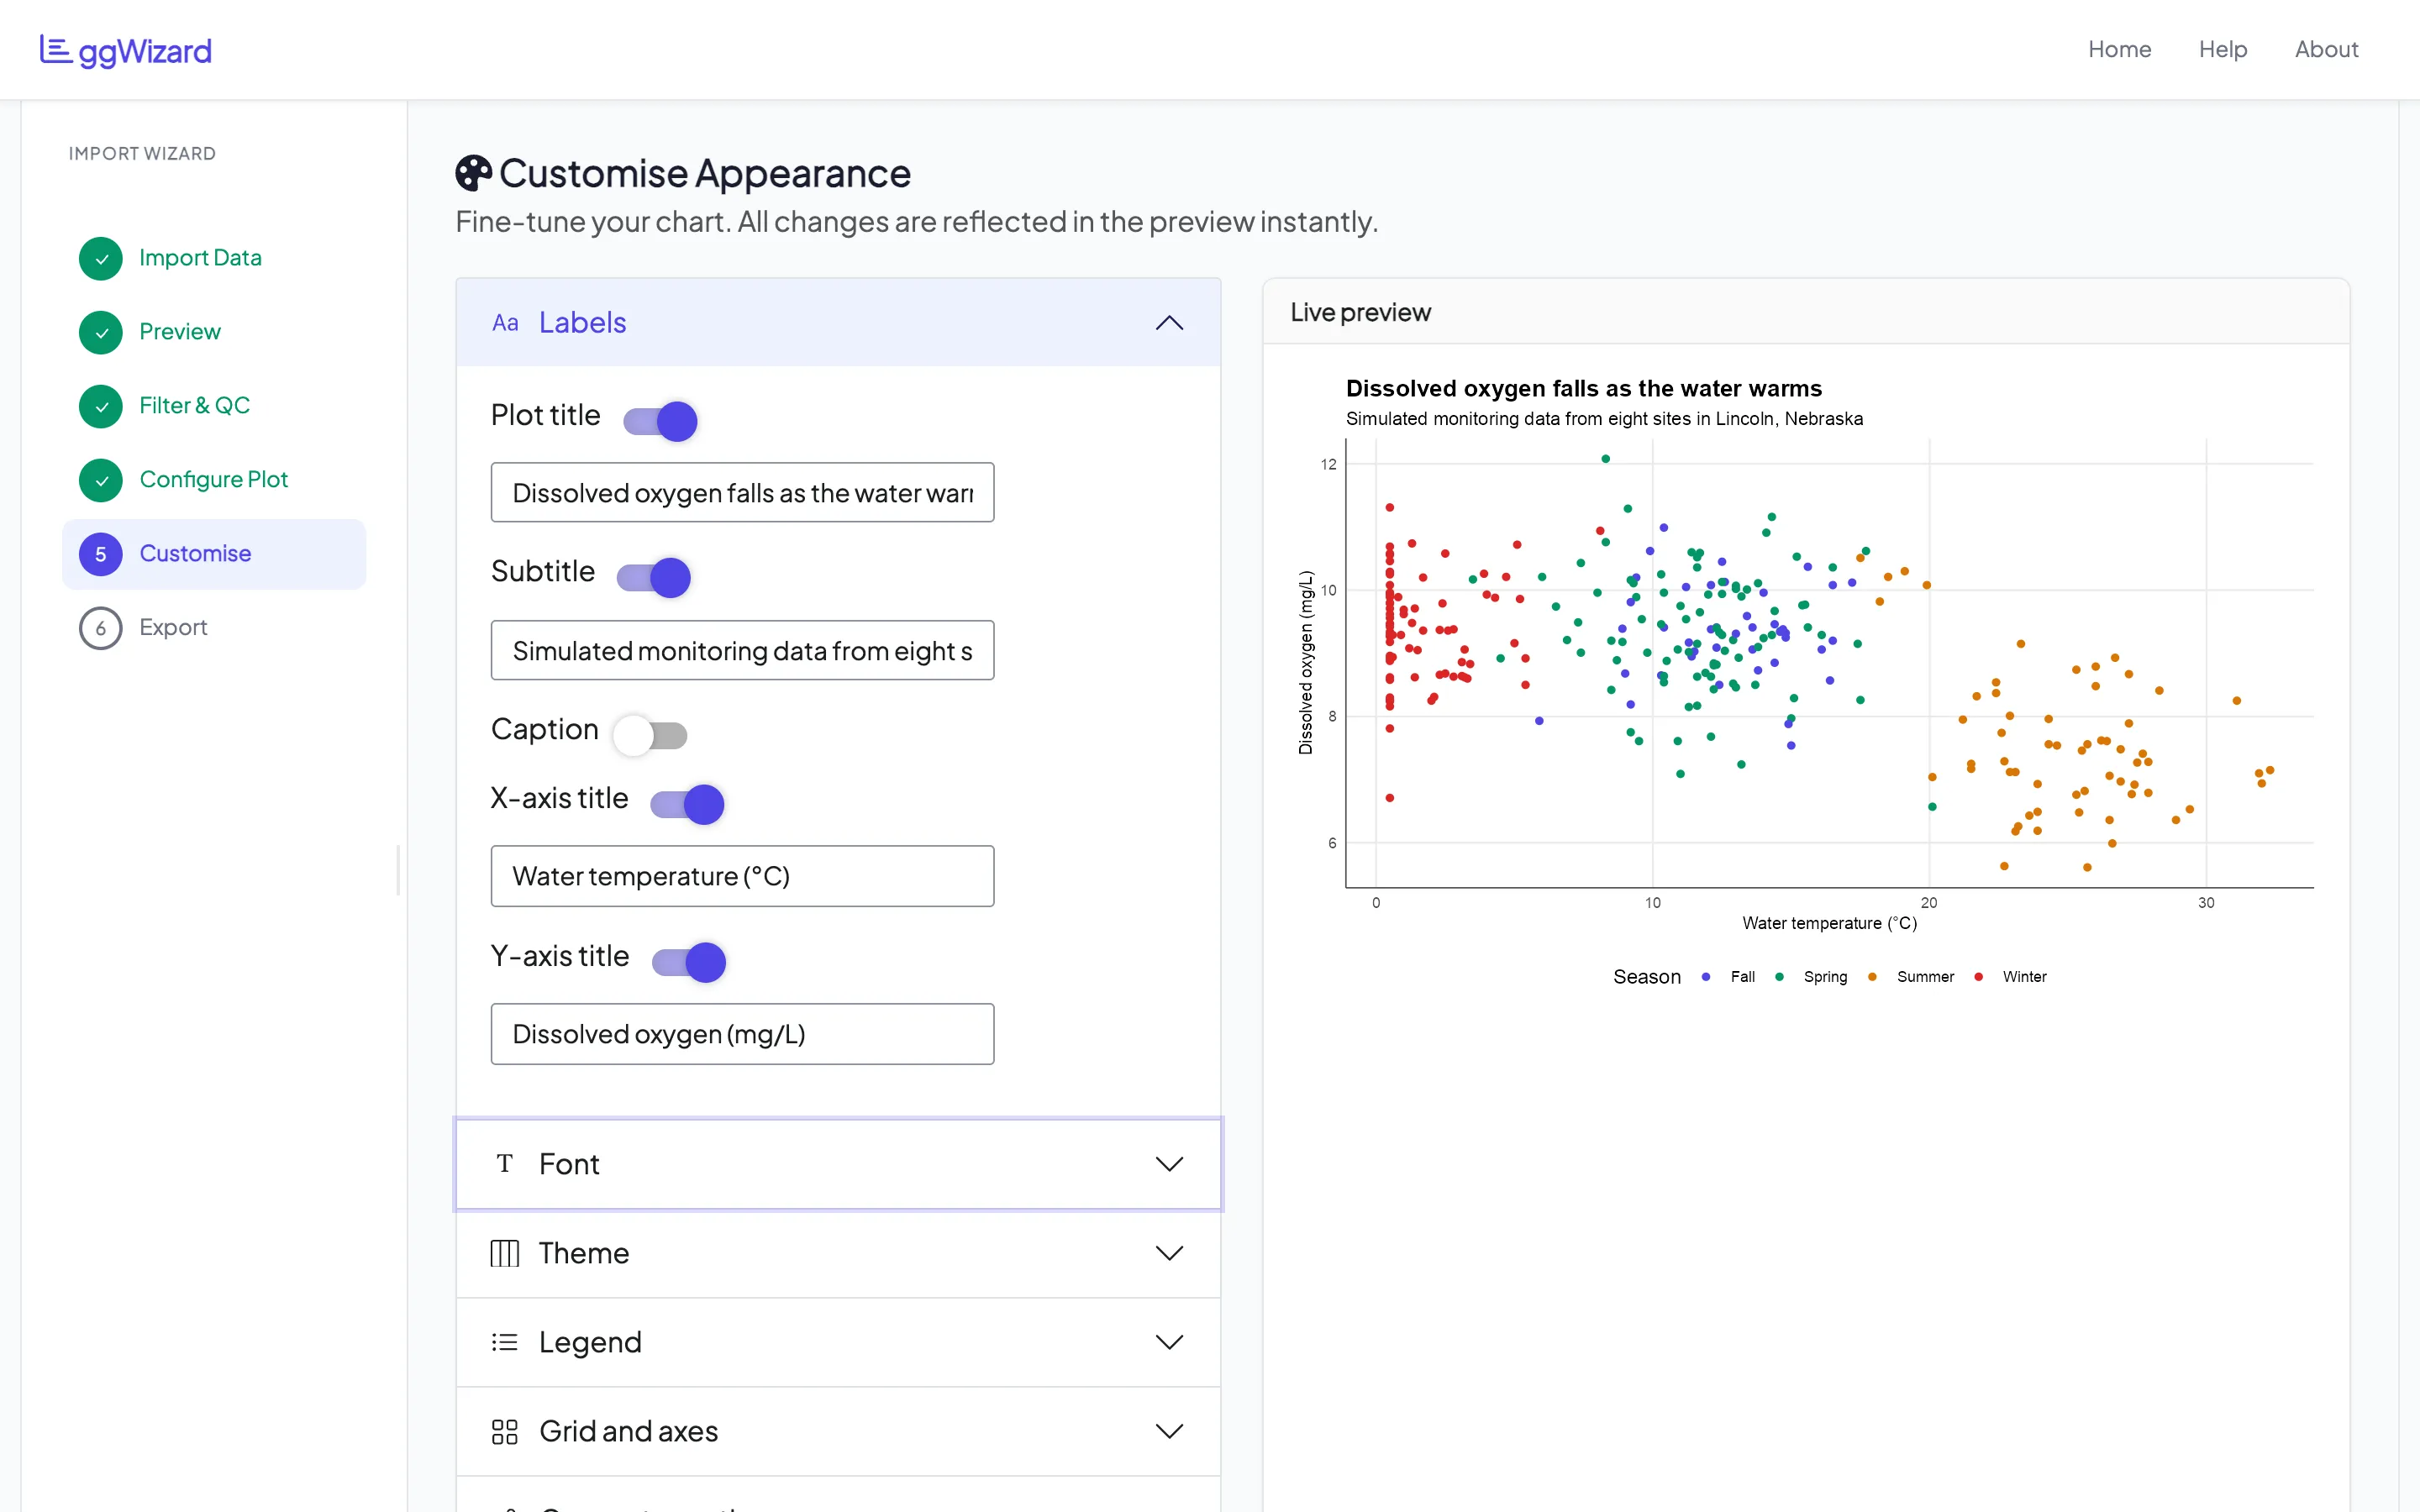
A Shiny wizard for making ggplot2 charts from a CSV or Excel file without writing code. You check and clean the data, pick one of eight chart types and style it, then export it with the R script behind it.
A Shiny app for building genetic linkage maps and mapping QTL without writing code. It began as the final-year project of two colleagues and me at KNUST. Now it's an R package, with a hosted copy that runs in the browser.
A Shiny app for cluster analysis of marker, trait and sequence data. My colleagues and I built the first version at KNUST in 2022. In 2026 I rewrote it as an R package with a live demo.
Tools: R · Shiny · golem · ape · cluster · msa · ggtree · ggiraph
A book about 600 years old, written in a script nobody can read. Here's what's known about it and why no codebreaker has cracked it, with a note on my own work.