A Shiny app for building genetic linkage maps and mapping QTL without writing code. It began as the final-year project of two colleagues and me at KNUST. Now it's an R package, with a hosted copy that runs in the browser.
kinds of mapping population (F2 intercross, backcross and RIL)
3
steps from a genotype file to a report
7
functions exported for scripting
35
Building a linkage map in R usually means scripting the onemap package one step at a time. To look for QTL you then carry the map over to R/qtl. Linkmapper puts both behind a point-and-click interface. It’s meant for genetics students and instructors. It works with F2 intercrosses, backcrosses and recombinant inbred lines. There’s a hosted copy too, so you can try it without installing anything.
How it works
Load a MAPMAKER or onemap genotype file. Traits can sit in the same file or come from a separate CSV.
Check quality. The app counts missing data for each marker and each individual. It also runs a chi-square segregation test on every marker, with a Bonferroni correction. Filters remove the markers you don’t want.
Group markers into linkage groups by LOD score and maximum recombination fraction. The app suggests a LOD threshold for your data.
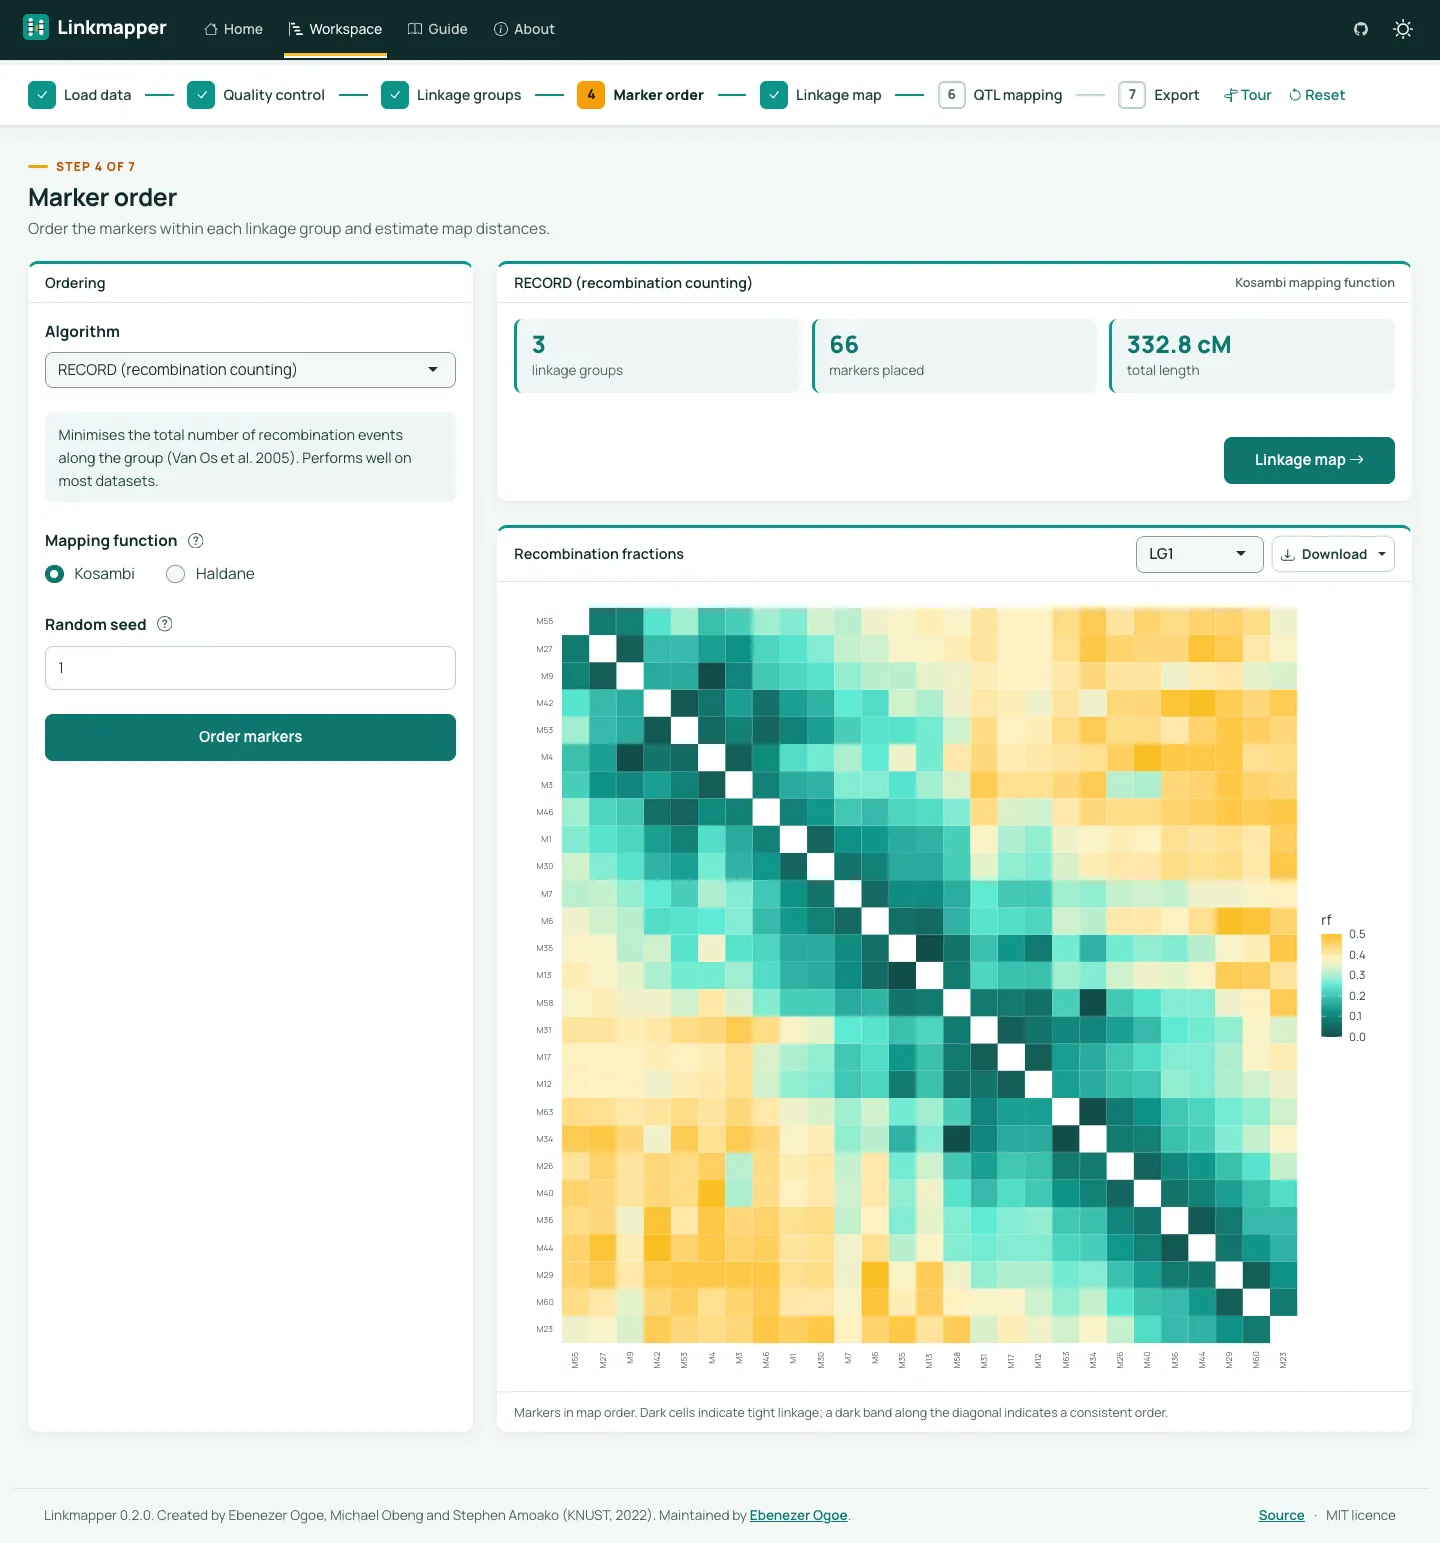
Order the markers in each group with RECORD, RCD, unidirectional growth or seriation, using Kosambi or Haldane distances. A heatmap of recombination fractions shows whether the order hangs together.
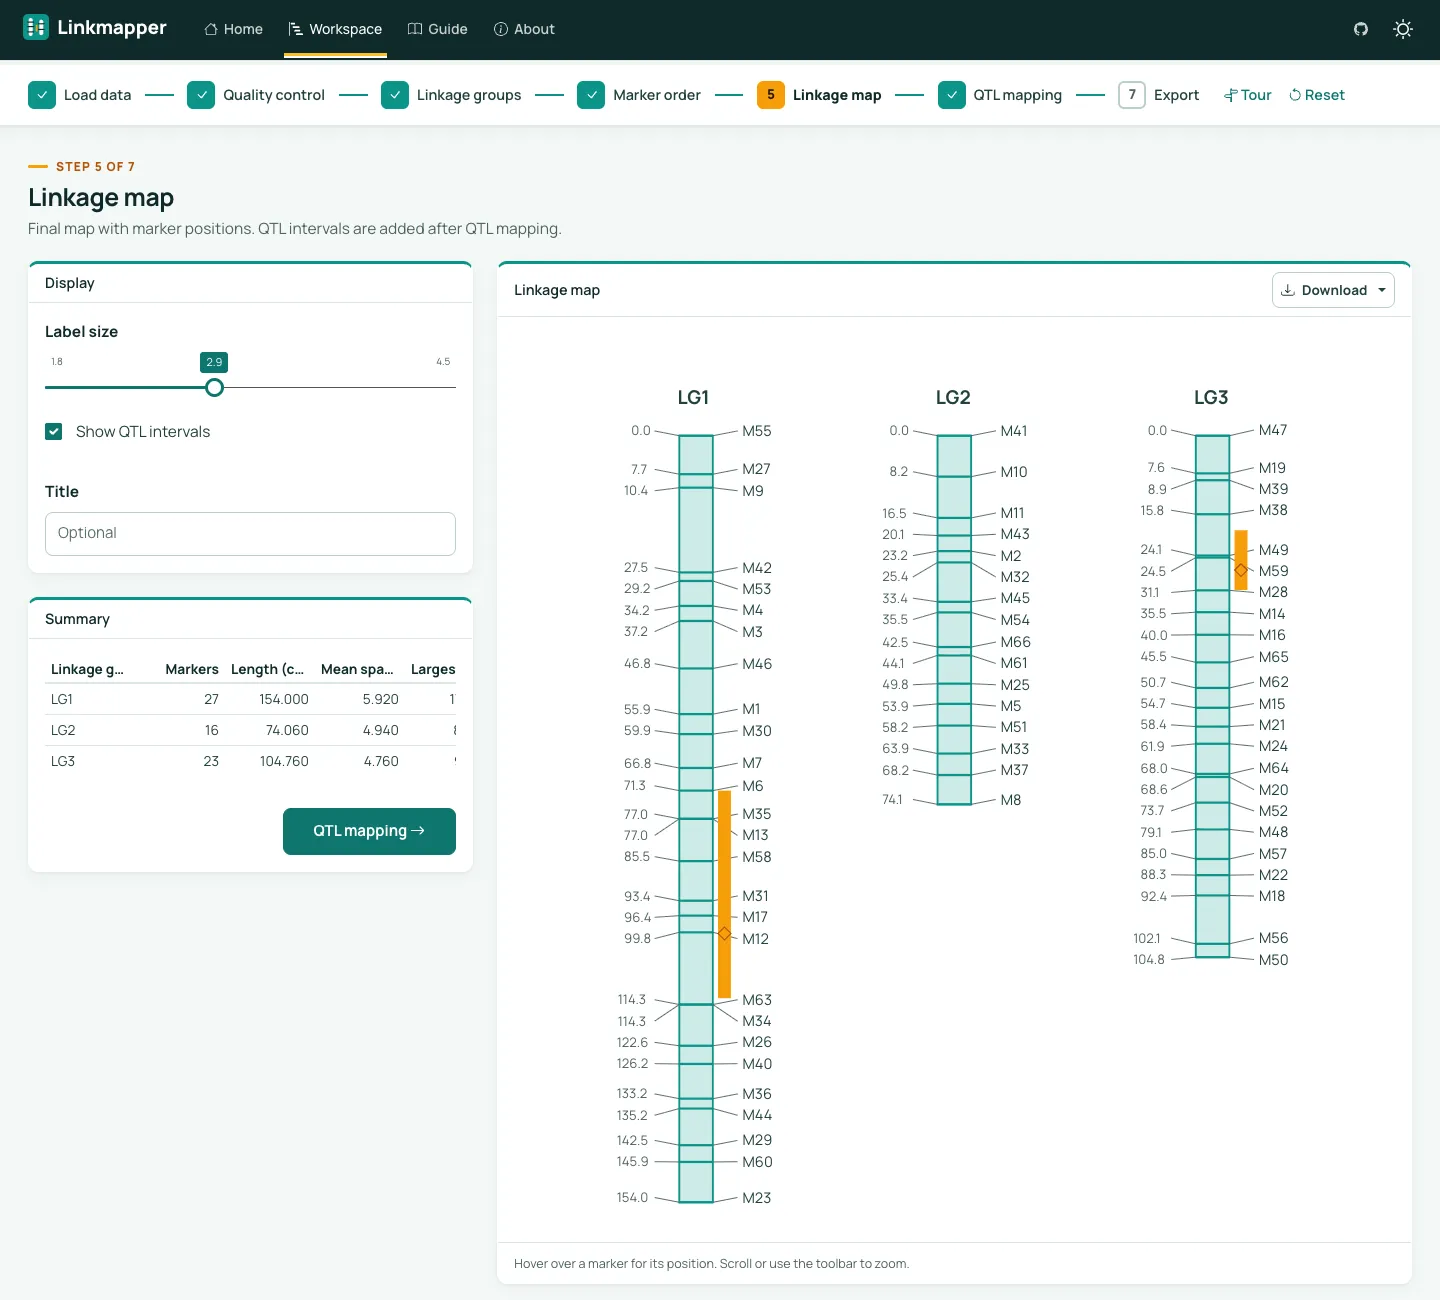
Draw the map, which shows marker positions as you hover. Export it as an image, a table or a MapChart file.
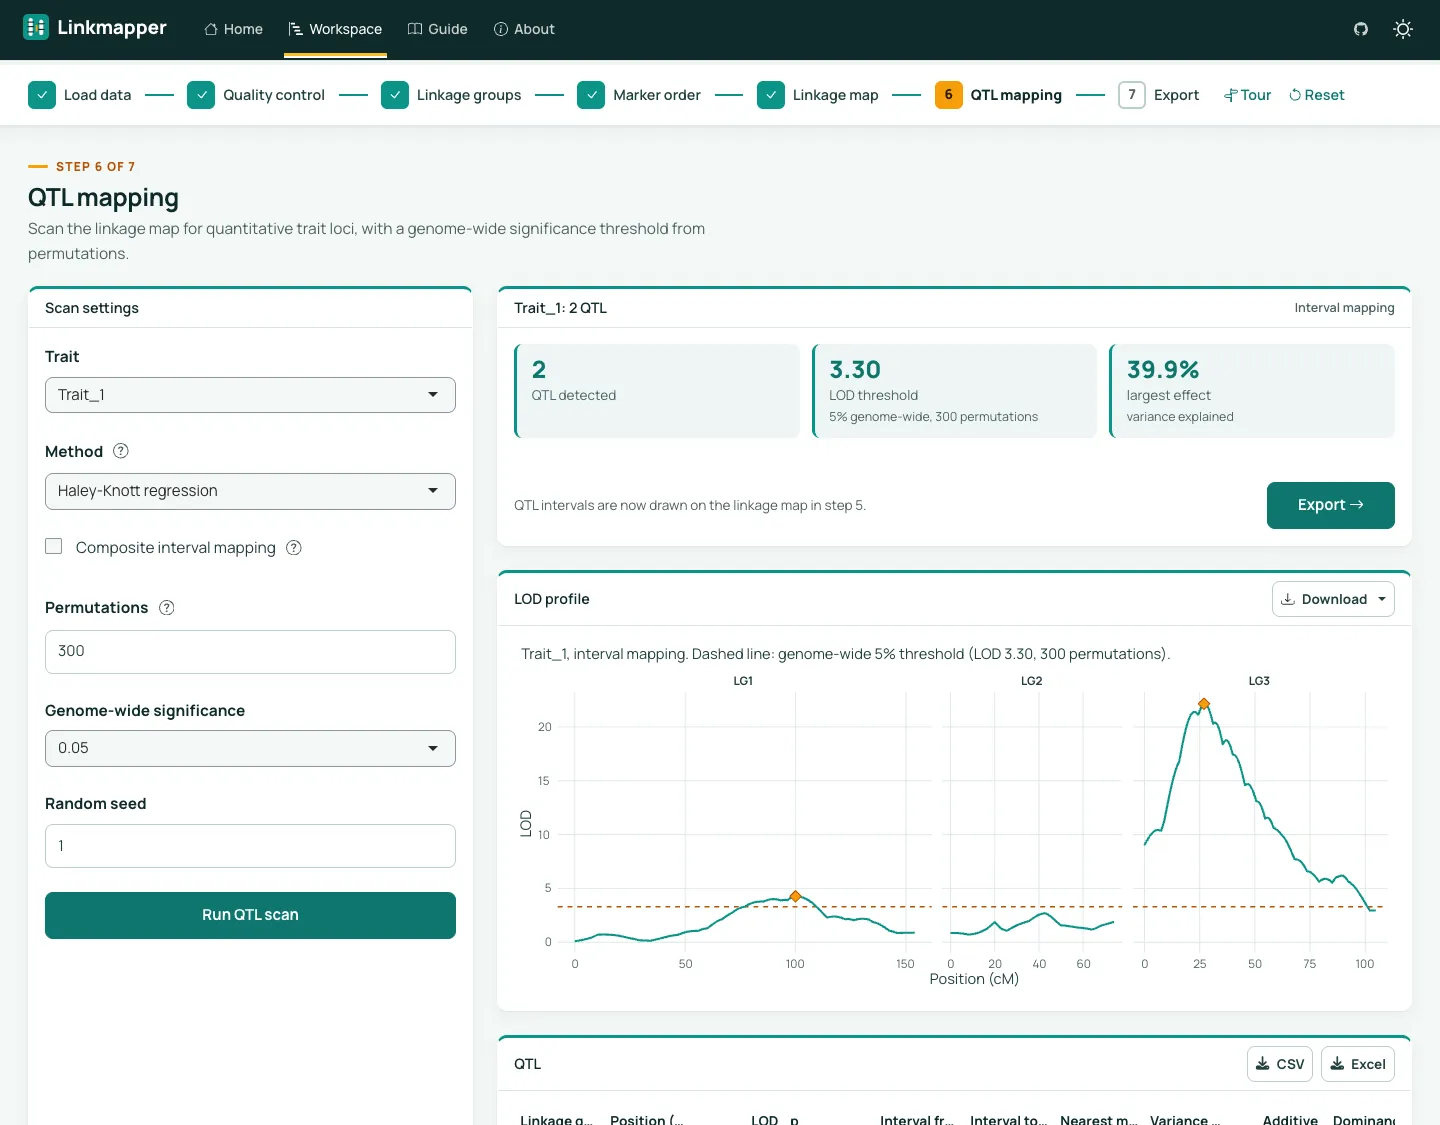
Map QTL by interval mapping or composite interval mapping. Permutations set the significance threshold. Each QTL comes with a 1.5-LOD support interval, its effect and the share of the variance it explains.
Download an HTML report, an R script that repeats the analysis, or a session file to pick up later.
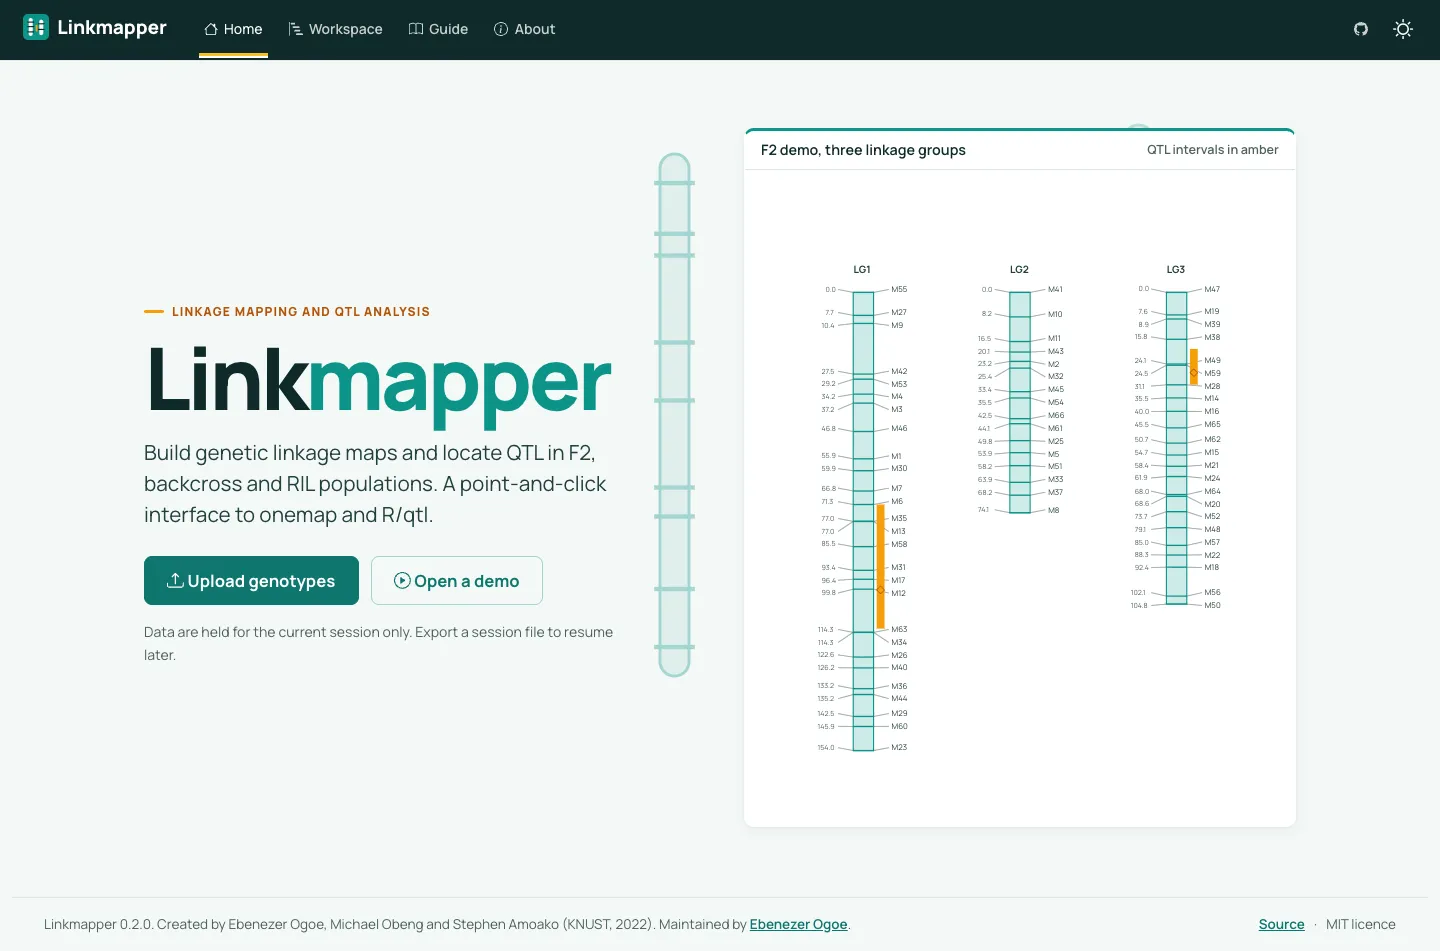
The demo is a simulated F2 population of 200 individuals and 66 markers. The markers fall into three linkage groups with a total length of 332.8 cM.
Figure 1. Marker order on the F2 demo. In the heatmap, a dark band along the diagonal means neighbouring markers are tightly linked, so the order is consistent.Figure 2. The finished map, with the QTL intervals from the next step drawn on it.Figure 3. QTL mapping on the demo trait. Two peaks clear the genome-wide threshold, one on each of linkage groups 1 and 3.
From app to package
My colleagues and I wrote the first version as our final-year project at KNUST, as a single Shiny app. In June 2026 I turned it into an R package.
Version 0.2 is a rewrite, and the three functions from version 0.1 still work as before. Each step is now its own module and its own exported function, so you can also run the analysis from a script:
The rewrite also fixed problems in the old version. Analysis state was held in global variables, so two people using the hosted app at once could interfere with each other. The QTL step found nothing on the demo data. The map image was written into the working folder. Marker order could change from one run to the next.
I plan to write Linkmapper up as a short software paper. Clusnalyst, the other app from the same final-year project, has been through the same rewrite into a package.
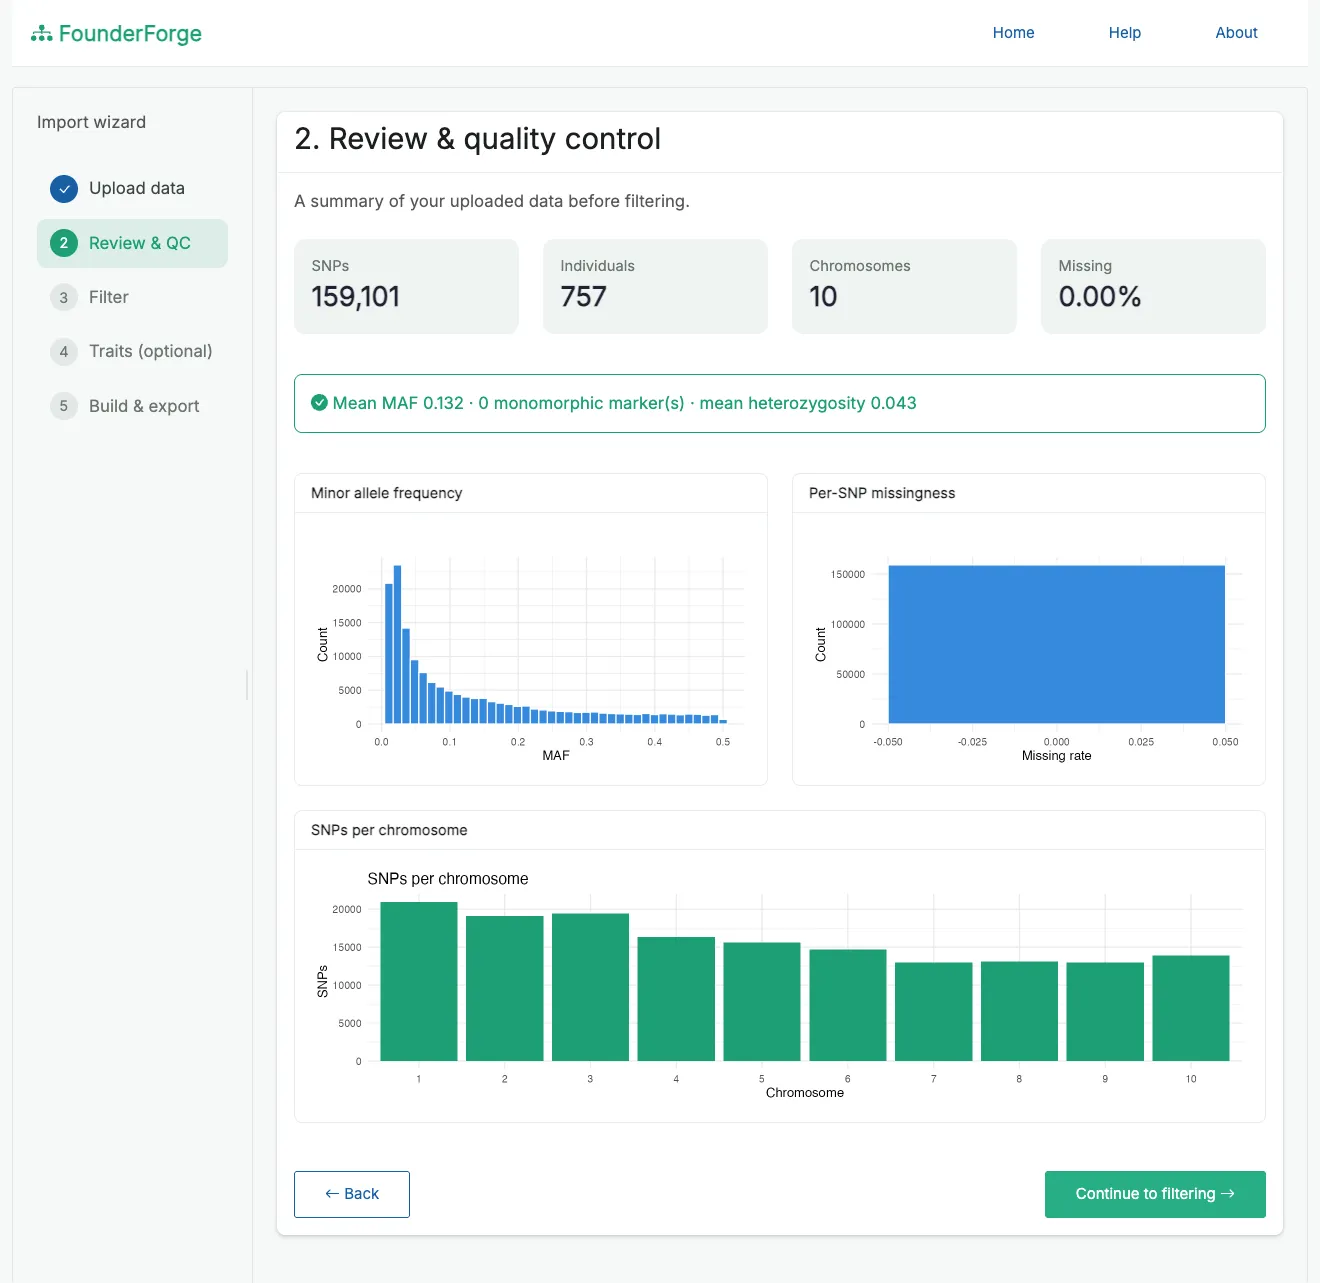
A Shiny app that turns real marker data into an AlphaSimR founder population without writing R. Load a VCF, HapMap, numeric or PLINK file, check it, filter it and export what newMapPop() needs.
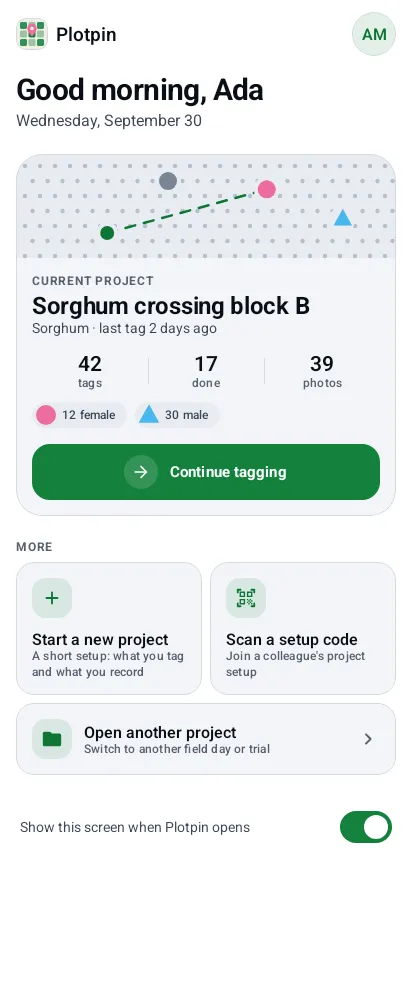
An Android app for finding a plant again. I built it to walk back to bagged sorghum plants in a crossing block. Now it works for anyone who marks points in a field.
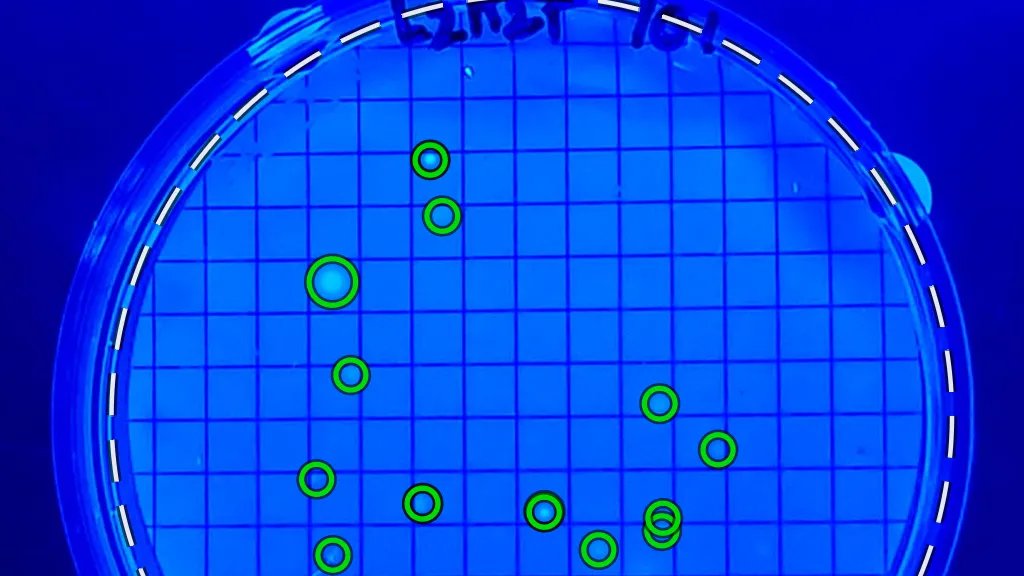
An Android app that counts bacterial colonies from plate photos, offline. Two small YOLO models do the counting, in about three quarters of a second a plate on my phone.
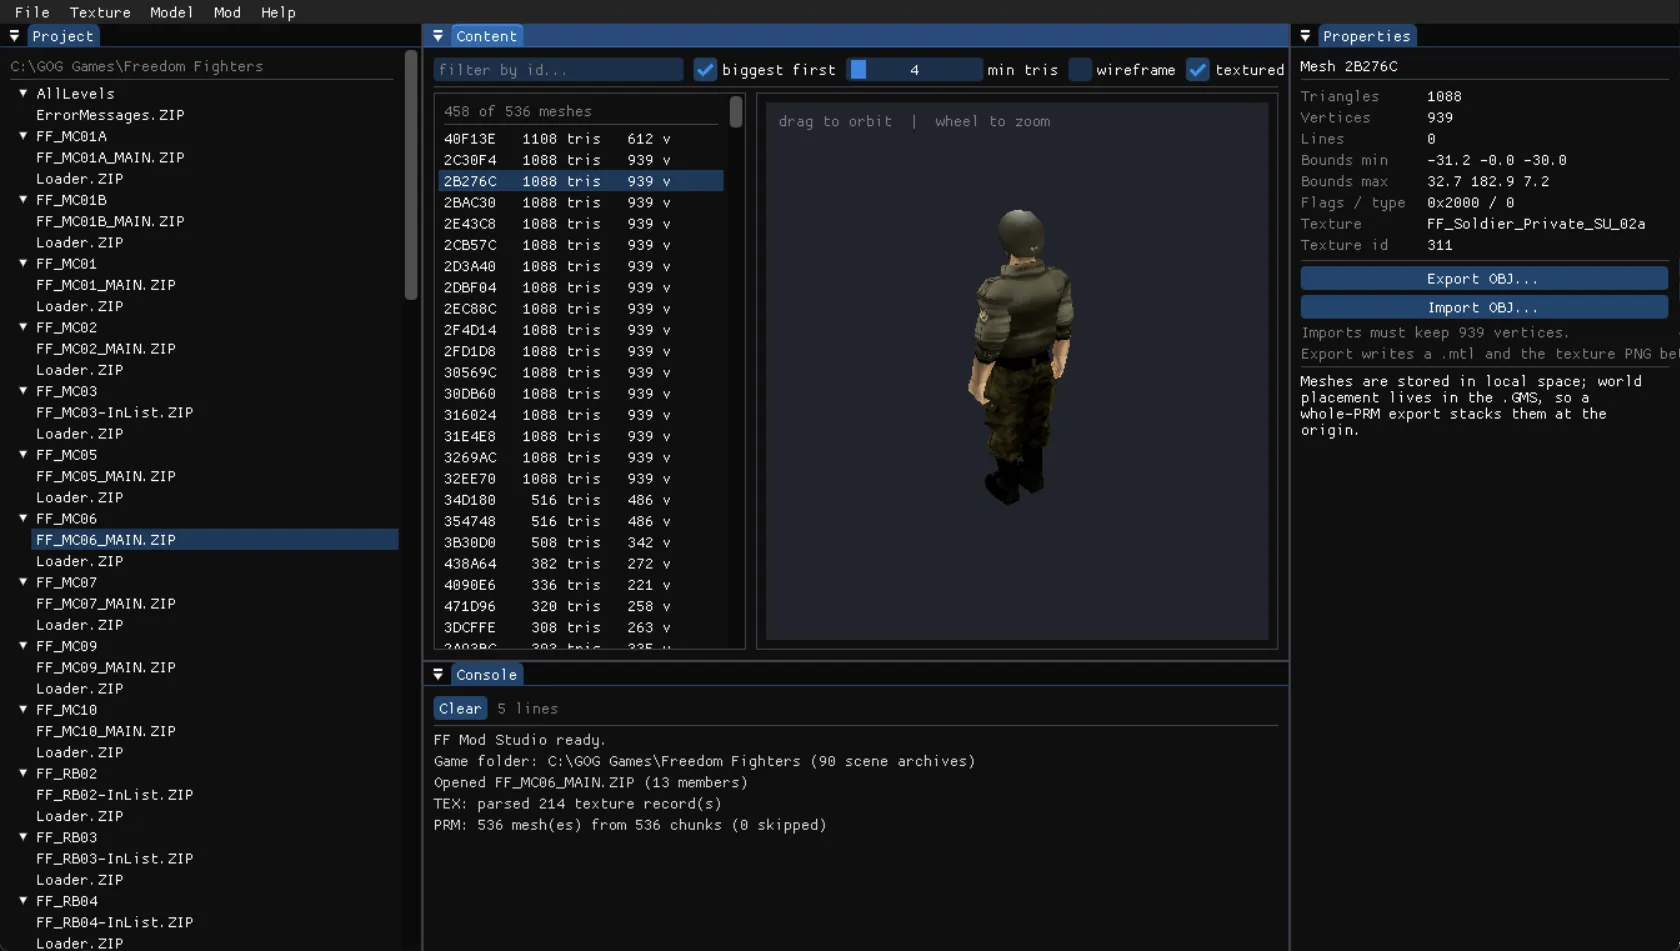
Tools for modding Freedom Fighters, a game from 2003. There's an editor for its textures and models, plus a Blender addon that sends edits back into the game.
A Shiny wizard for making ggplot2 charts from a CSV or Excel file without writing code. You check and clean the data, pick one of eight chart types and style it, then export it with the R script behind it.
A Shiny app for cluster analysis of marker, trait and sequence data. My colleagues and I built the first version at KNUST in 2022. In 2026 I rewrote it as an R package with a live demo.
Tools: R · Shiny · golem · ape · cluster · msa · ggtree · ggiraph
A book about 600 years old, written in a script nobody can read. Here's what's known about it and why no codebreaker has cracked it, with a note on my own work.