Intro
Every AlphaSimR simulation starts from a founder population: the genomes your simulated breeding programme begins with. AlphaSimR can simulate founders for you. For plenty of questions that’s fine. When the question is about a real crop, though, you want to start from real lines, with the allele frequencies and structure they actually have.
Getting real genotypes in means writing the same script each time. You read the marker file, check it, filter it, split each genotype into haplotypes, build a genetic map and hand the lot to newMapPop(). None of those steps is hard, but it’s easy to get one slightly wrong without any error to warn you.
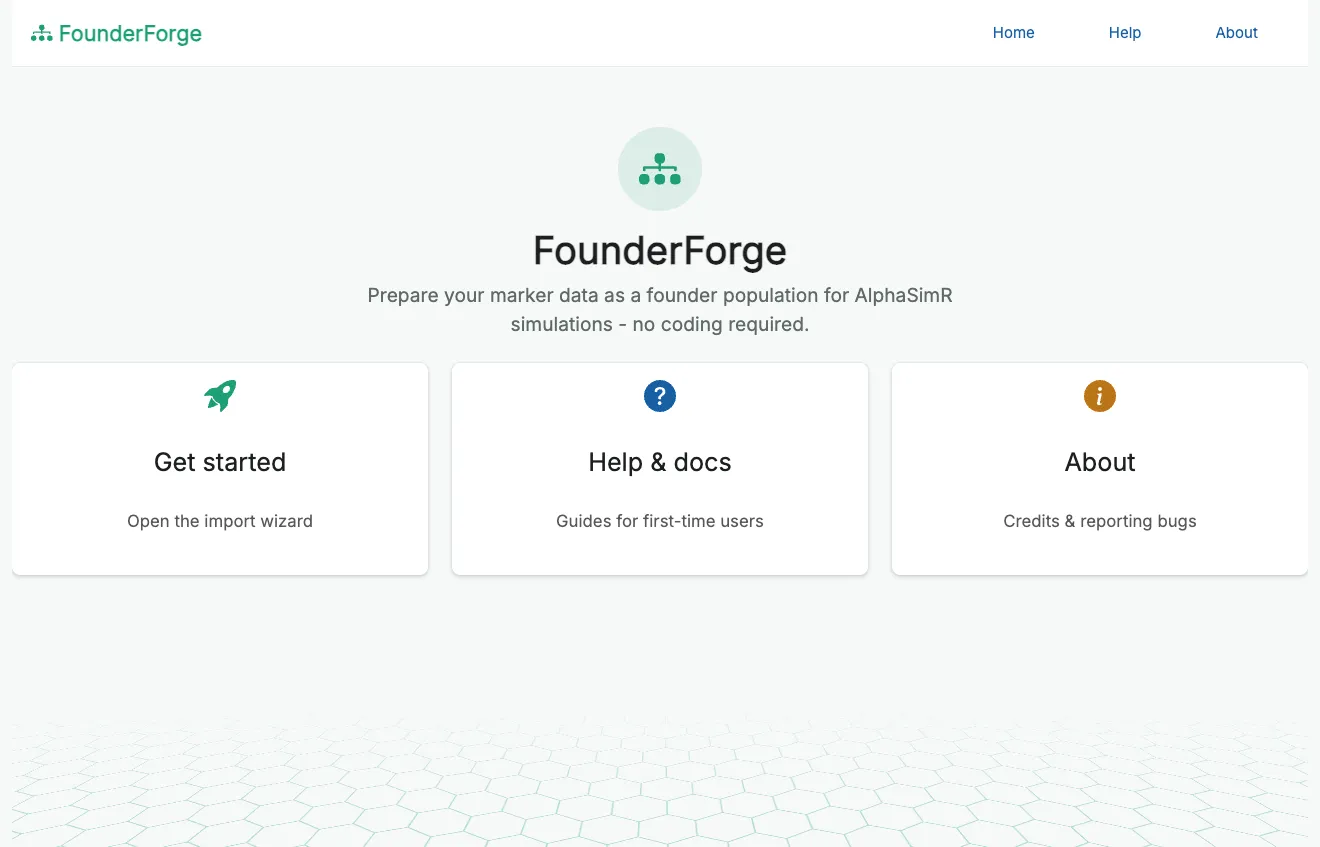
I was doing exactly this for my own breeding simulations, with sorghum lines from West Africa, so I put the whole process behind a point-and-click app. FounderForge is a Shiny app, built with golem and shipped as an R package. It takes five steps, with a look at your data before anything changes. At the end you have the objects AlphaSimR needs and a log of everything that happened on the way.
Five steps
The app is a wizard. The column on the left always shows where you are: upload, review and QC, filter, traits, then build and export. Traits are optional, and you can step back to change anything. Results are only written in the last step, to a folder you choose.
There are sample datasets built in, 300 markers on 30 individuals across 3 chromosomes, so you can click through the whole thing before trusting it with your own data.
Getting the data in
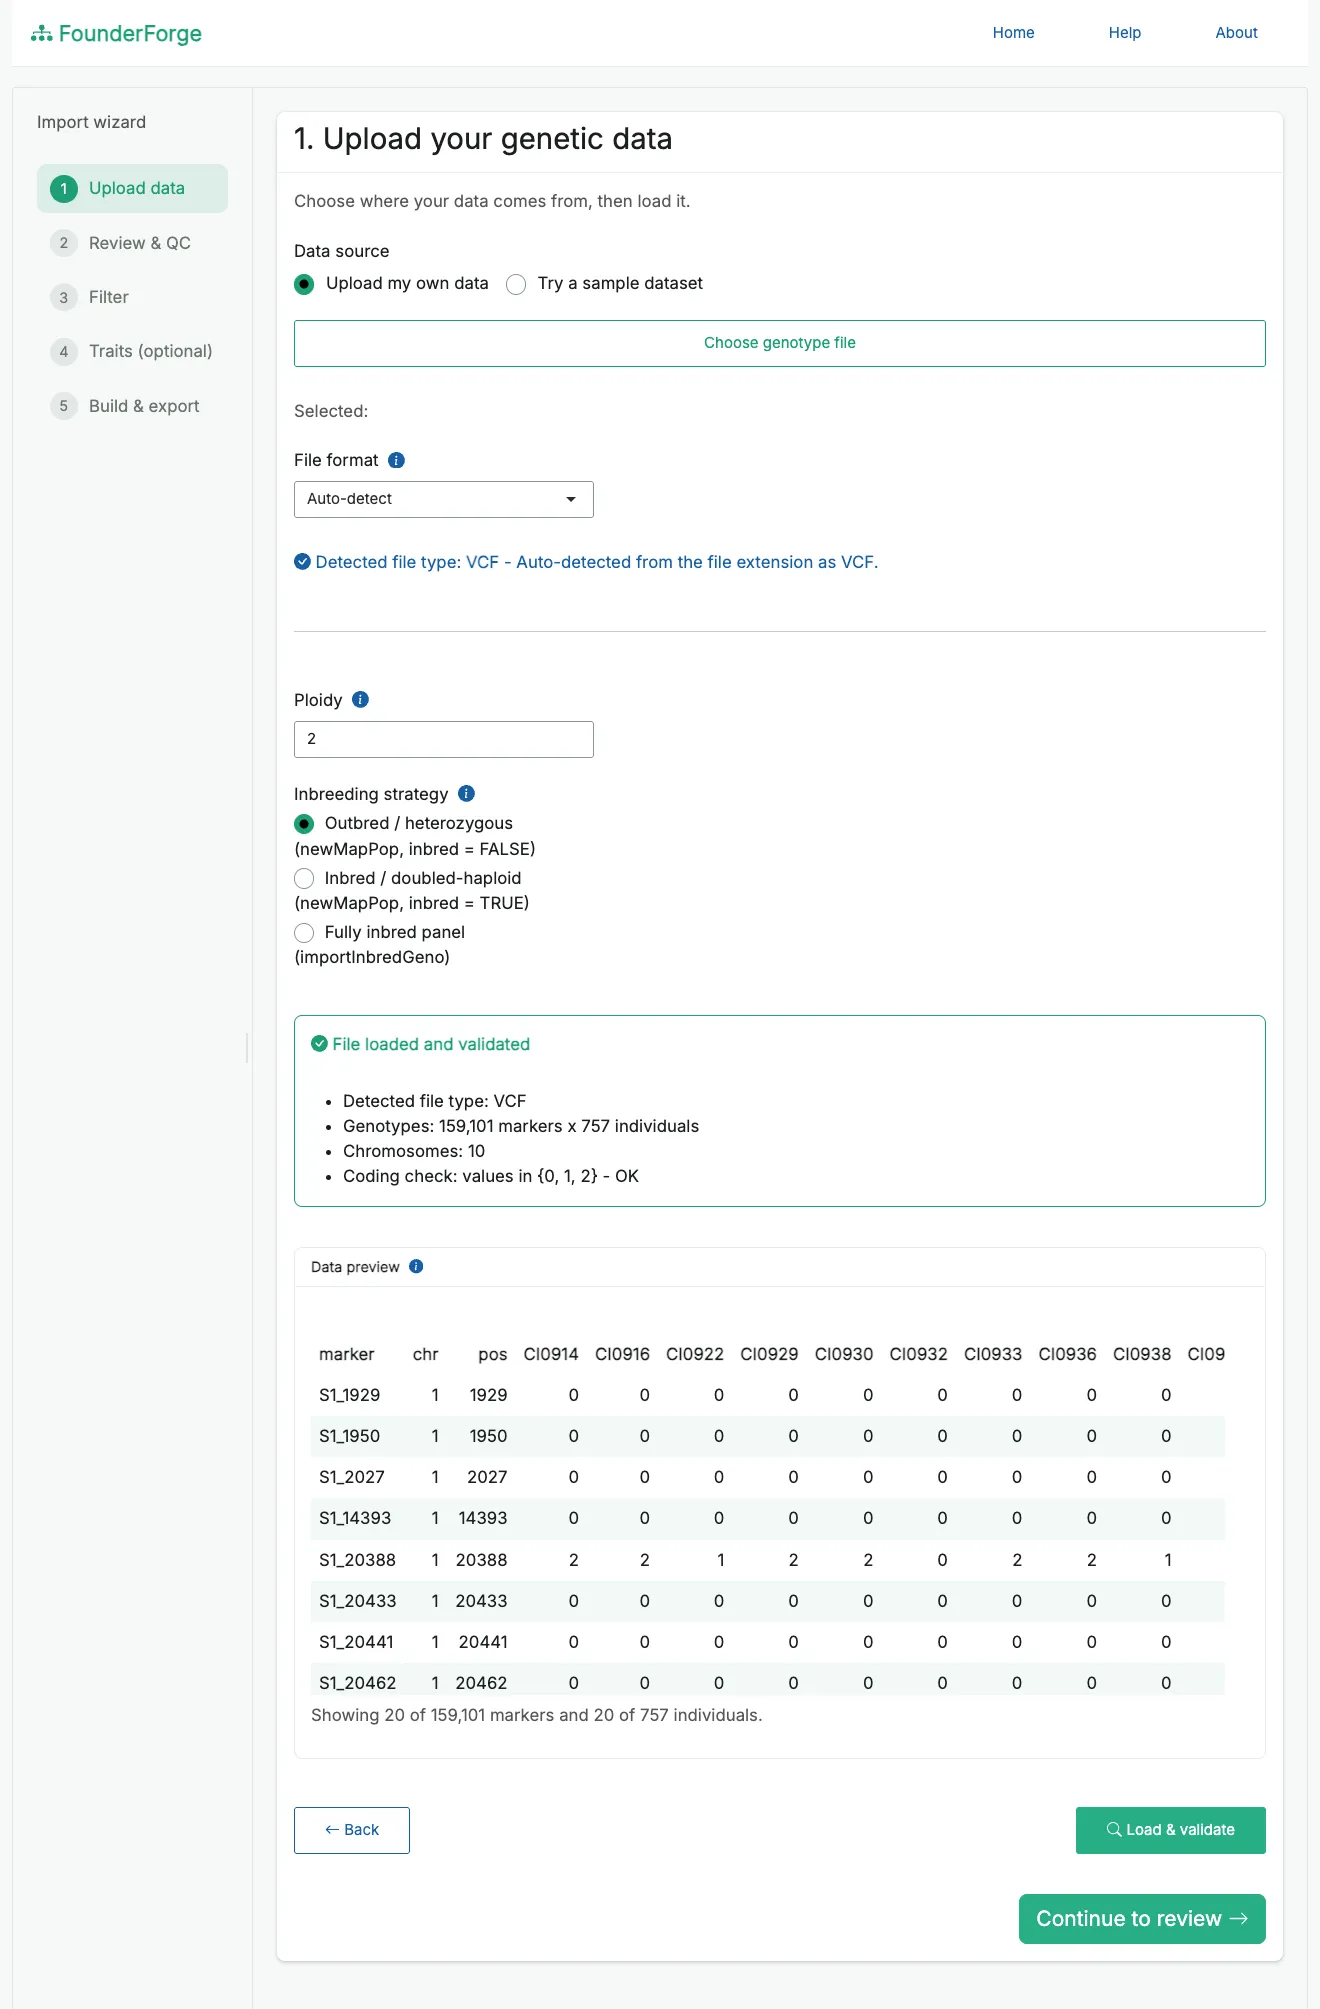
FounderForge reads four kinds of marker file and works out which one you’ve given it from the extension.
| Format | Files | What it reads |
|---|---|---|
| VCF | .vcf, .vcf.gz |
Biallelic SNPs, with the GT field turned into 0, 1 or 2 |
| HapMap | .hmp.txt |
TASSEL-style calls, two-letter and IUPAC |
| Numeric | .csv, .rds, .rdata |
A 0/1/2 dosage table with a marker map |
| PLINK | .raw, .ped with .map |
.raw from plink --recodeA, or text .ped and .map |
Wide tables come in every shape, so it looks for the usual names for the chromosome, position and marker columns (chrom, pos, rs# and their variants) and skips the metadata columns that TASSEL adds. Sample names with lane and flowcell suffixes, like LINE1:FLOWCELL:LANE, can be cleaned up with one click.
Look before you filter
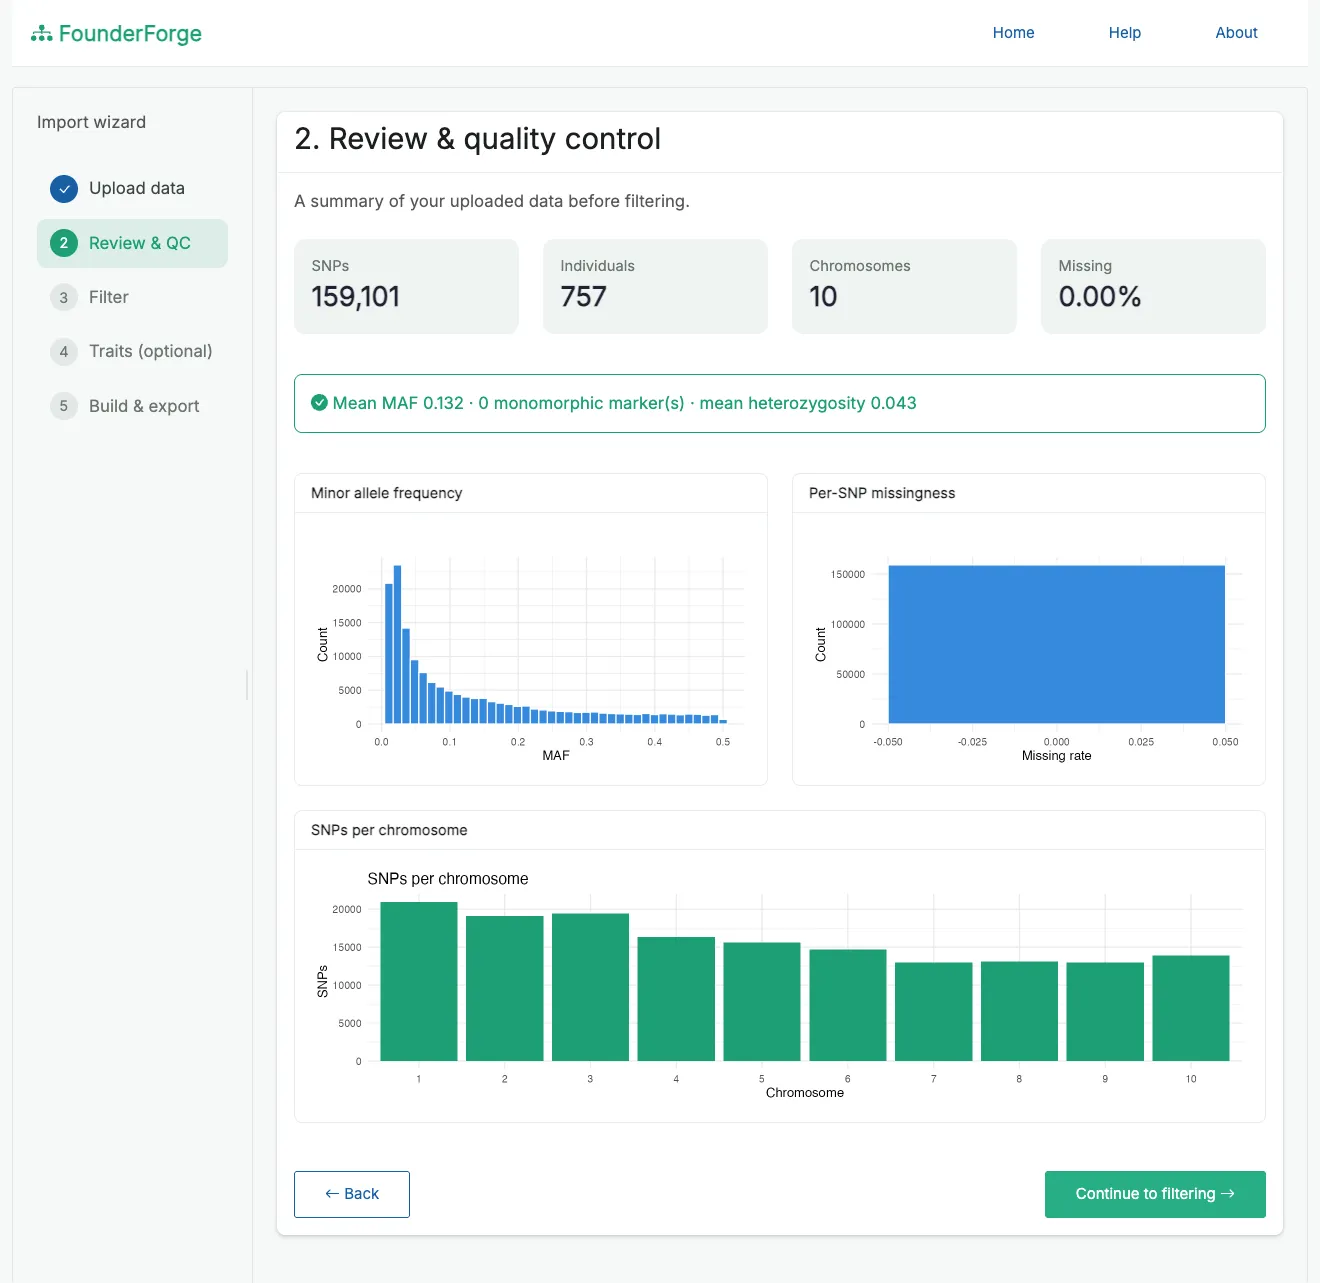
Step two doesn’t change anything. It’s a summary of what you loaded: how many SNPs and individuals, how much is missing, minor allele frequencies, heterozygosity and how the markers spread over the chromosomes.
For that sorghum panel it showed 159,101 SNPs on 757 lines over 10 chromosomes, no missing calls, a mean minor allele frequency of 0.132 and a mean heterozygosity of 0.043. That last number is low, and for sorghum it should be. Most of these lines are inbred, which matters for the import strategy below.
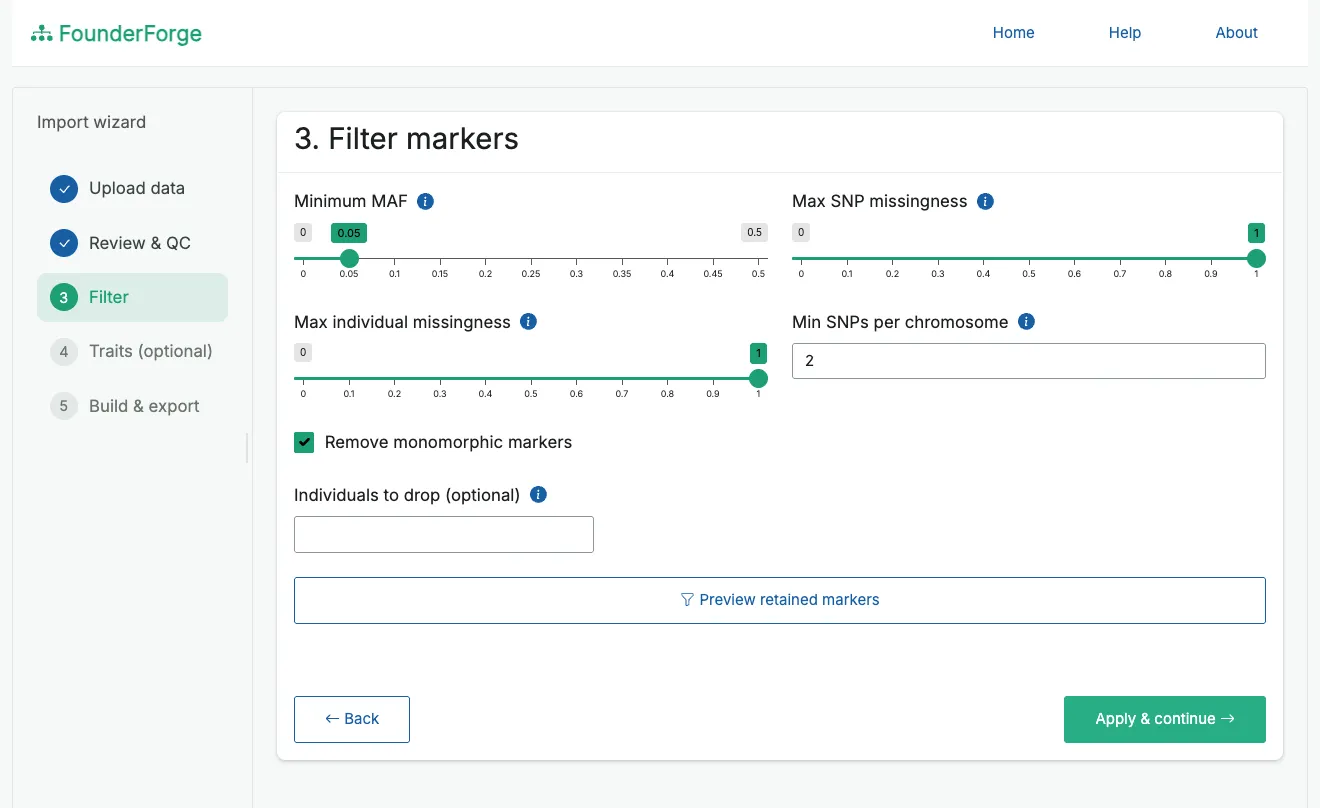
Then comes filtering. You can set a minimum minor allele frequency, a maximum missingness per SNP and per individual, and a minimum number of SNPs per chromosome. You can also drop monomorphic markers, or drop individuals by name. A preview tells you how many markers would survive before you apply anything.
Inbred or outbred
AlphaSimR wants haplotypes, but a marker file gives you genotypes: 0, 1 or 2 copies of the alternative allele. Getting from one to the other took the most care. FounderForge offers three ways, each explained in plain language on the upload page.
For outbred material, every genotype is split into two haplotypes. Each 0 becomes 0 and 0, each 2 becomes 1 and 1, and each heterozygous 1 becomes 0 and 1, so the heterozygosity survives the trip:
hap1 <- t(g %/% 2L)        # 0 -> 0, 1 -> 0, 2 -> 1
hap2 <- t(g - (g %/% 2L))  # 0 -> 0, 1 -> 1, 2 -> 1
The catch is phase. Two neighbouring heterozygous loci could sit on the same chromosome copy or on different ones. A genotype file doesn’t say which. FounderForge splits them the same way every time, so heterozygotes come out unphased. The run log says so.
For inbred or doubled-haploid lines, each individual becomes a single haplotype. Any heterozygous calls are rounded to the nearest homozygote, and the log counts how many there were. The third option hands a fully inbred panel straight to AlphaSimR’s own importInbredGeno().
Choosing the wrong strategy won’t raise an error. Your founders will just be more or less heterozygous than your real plants, with the mistake carried into every generation you simulate after that.
Build it, then check it
The last step builds the genetic map, makes the population and saves everything. The map assumes 1 cM per megabase along every chromosome, which turns a position in base pairs into Morgans by dividing by 108. Each chromosome then starts at 0, as newMapPop() requires.
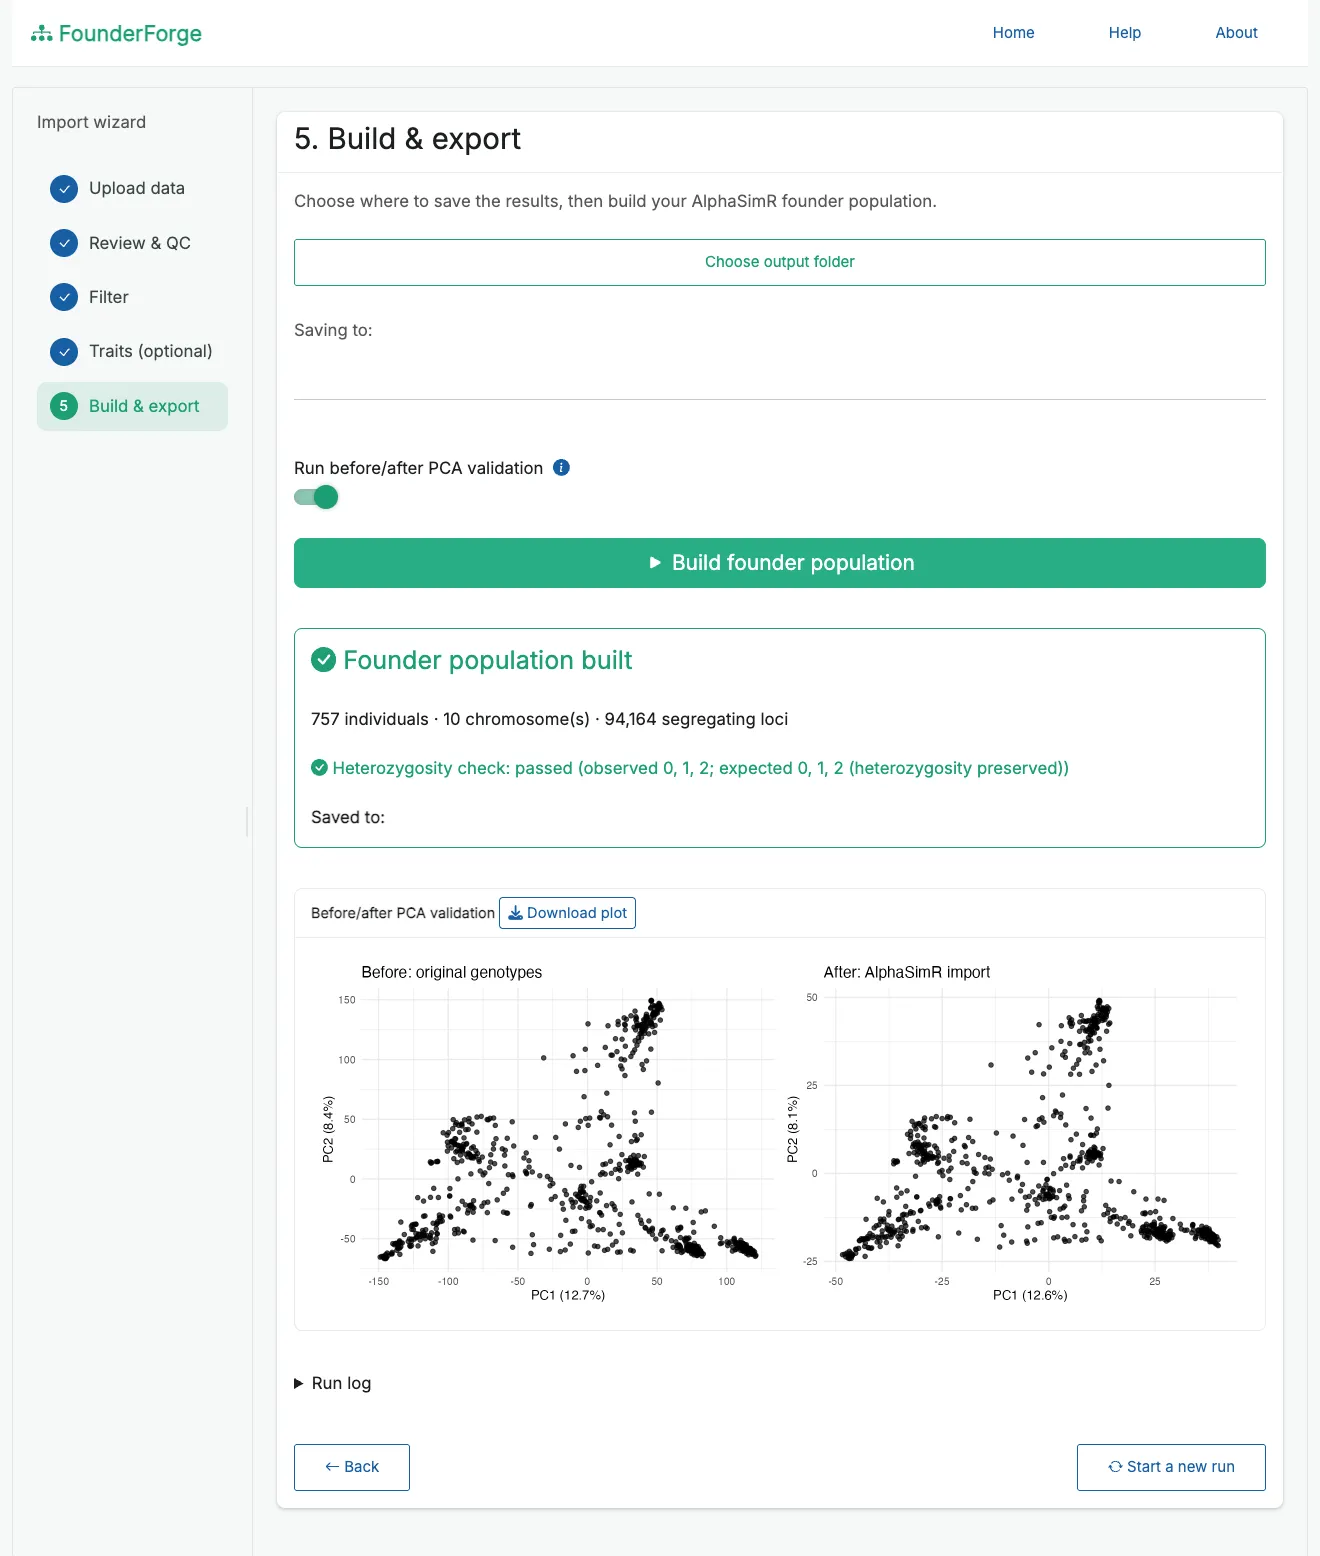
After that, the app checks its own work twice. First heterozygosity: an outbred import should come back with 0, 1 and 2 all present, and an inbred one with only 0 and 2. Then, if you ask for it, a PCA of the genotypes before and after the import. If the two plots look different, something went wrong between your file and AlphaSimR.
For the sorghum panel, 94,164 segregating loci made it through. The two PCA plots have the same shape. The first two components explain 12.7% and 8.4% of the variation before the import against 12.6% and 8.1% after.
What you get
Every run gets its own timestamped folder, so nothing is overwritten:
FounderForge_run_<timestamp>/
├── founder_population/
│   ├── genmap.rds          # per-chromosome genetic maps, in Morgans
│   ├── haplotypes.rds      # per-chromosome haplotype matrices
│   ├── founder_pop.rds     # the AlphaSimR MapPop
│   ├── sim_param.rds       # a SimParam, if you defined traits
│   └── rebuild_snippet.R   # the exact call that built it
├── qc/                     # qc_summary.csv and the plots
├── validation/             # heterozygosity check and PCA
└── logs/                   # the full run log
genmap.rds and haplotypes.rds are what newMapPop() takes. founder_pop.rds is the finished MapPop, so a simulation can start from it straight away:
library(AlphaSimR)

founderPop <- readRDS("founder_population/founder_pop.rds")
SP <- SimParam$new(founderPop)   # or readRDS("founder_population/sim_param.rds")
pop <- newPop(founderPop, simParam = SP)
rebuild_snippet.R rebuilds the population from the two .rds files, so anyone reviewing your simulation can see exactly how the founders were made.
What it assumes
Every run log ends with a section listing what the app assumed. These are the ones that matter most:
- The genetic map is uniform. Real recombination rates vary along a chromosome, so if you have a real map, use it.
- Heterozygotes in outbred material are split, not phased.
- If you add traits, AlphaSimR places the QTL at random, and the means, variances and heritabilities are numbers you supply.
It’s version 0.1.0, on my r-universe with prebuilt binaries, so there’s nothing to compile:
install.packages("FounderForge",
  repos = c("https://ebenogoe.r-universe.dev", "https://cloud.r-project.org"))

library(FounderForge)
run_app()
It runs on your own computer rather than a server because genotype files get big. A local app can read them straight from disk and write its results to a folder you pick. If something breaks, the run log is the most useful thing you can send me, since it has every step from import to export.